 So far in 2025, Brad Keller, Mike Tauchman, Nicky Lopez, and Reese McGuire pushed the total of players I’ve seen take the field in person for both the Cubs and the White Sox to 47. With the final round of crosstown kicking off tonight at Rate Field, here’s a look at those players, in alphabetical order.
 David Aardsma
After posting a decent season with the Cubs in 2006, Aardsma was traded to the White Sox for Neal Cotts. Aardsma lasted one season with the Sox, where he was unable to duplicate his success from the year before.
Jason Bere
Drafted by the White Sox in the 36th round in 1990, Bere debuted with the big-league club in 1993, finishing 2nd in Rookie of the Year voting. After an All Star selection in 1994, injuries marred the remainder of his tenure on the South Side, which ended in 1998. He resurfaced with the Cubs in 2001 and had a decent season, but he went 1-10 in 2002 before being let go.
 Emilio Bonifacio
Bonifacio spent back-to-back partial seasons in Chicago, first for the Cubs in 2014 after signing as a free agent, where he played decently enough to be flipped at the trade deadline, along with James Russell, to the Braves for a young catching prospect by the name of Victor Caratini. He returned to Chicago in 2015, signing with the White Sox, where he he did not do well at all, hitting .167 in 47 games before being released in August.
Welington Castillo
Debuting with the Cubs in 2010, Castillo spent time behind the plate for the Cubs until May of 2015, when, having been replaced in the starting lineup by Miguel Montero, he was flipped to the Mariners. He returned to Chicago in 2018 after signing with the White Sox as a free agent. On May 24th of that season, he was suspended 80 games for a violation of the PED policy. The White Sox then cut bait following the 2019 season, shipping him off to the Rangers.
Neal Cotts
Acquired by the White Sox in the Billy Koch trade, he debuted with the team in 2003. He was a key contributor in the bullpen during the 2005 championship season and was the only relief pitcher to appear in all 3 rounds of the playoffs that season. Following the 2006 season, he was traded to the Cubs for David Aardsma, and he spent the next 3 injury filled seasons on the North Side.
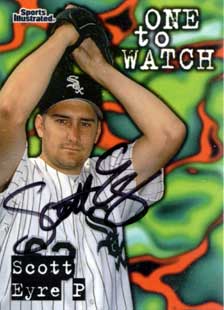
 Scott Eyre
Joining the White Sox organization in a 1994 trade with the Rangers, he debuted with the big-league team in 1997. He split the next 4 seasons between the rotation and the bullpen, not to mention between Chicago and Charlotte, before being moved to the Blue Jays following the 2000 ALDS loss to the Mariners. He joined the Cubs as a free agent for the 2006 season and enjoyed 2 seasons of relative success, before falling apart in 2008, when he was traded to the Phillies.
Clint Frazier
After missing the second half of 2021 with an injury, Frazier was DFA’d by the Yankees. He signed a deal with the Cubs that offseason, though he notched just 45 plate appearances before being DFA’s once again. He chose to finish the year in the Cubs system before becoming a free agent following the season. After failing to catch on with the Rangers, he signed a minor league deal with the White Sox, eventually hitting .197 in 33 games with the big-league club.
Kosuke Fukudome Continue reading →
 Previously, we’ve looked at the most recent time I’ve seen each of the 30 major league baseball teams play. Three weeks into the 2026 season, I thought it would be worth going into the wayback machine and see when the first time was that I saw each team live and in person, to the best of my knowledge. My records only go back to 1984, so anything before that is as yet unidentified.