 Originally founded in 1869, the Chicago Cubs became a charter member of the National League in 1876. Over the next 150 seasons, the Cubs have played more than 22,000 games, scored over 103,000 runs and recorded more than 200,000 hits, more than any other team in baseball history. Nearly 2,300 players have worn a Cubs uniform, earning eight division titles, 17 NL pennants, and three World Series championships.
Fans have witnessed generations of unforgettable players, from historical heroes like Joe Tinker, Gabby Hartnett, Ernie Banks, and Billy Williams to more recent stars like Ryne Sandberg, Derrek Lee, Kerry Wood, and Anthony Rizzo. The team has called Wrigley Field home for 110 of those 150 seasons.
To celebrate this milestone, the Cubs are holding a fan vote to select the franchise’s anniversary team. Each week, we will go through the provided options for each position and declare who should, and, if different, who will, win the fan vote. We continue today with the eight selections for shortstop.
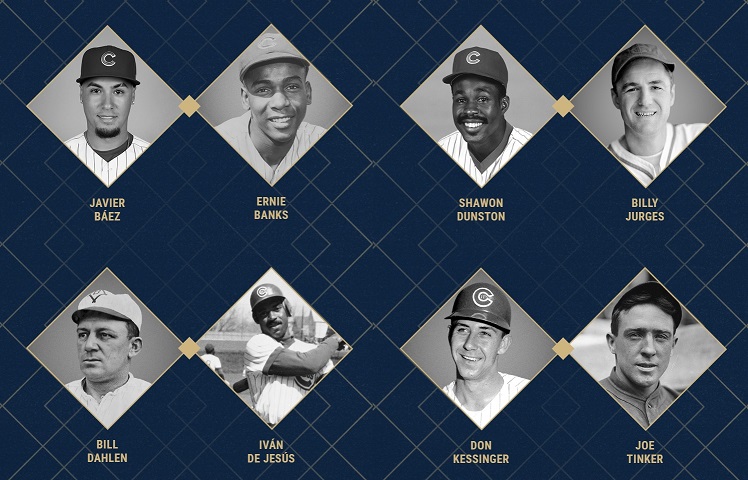 Javier Baez was drafted by the Cubs in the first round in 2011 and debuted with the big-league club in 2014. He became a starter in 2016, helping the Cubs end their 108-year championship drought by winning the World Series. His best season came in 2018, when he led the league in RBI and finished second in MVP voting. His tenure with the Cubs ended in 2021, traded to the Mets for a young prospect named Pete Crow-Armstrong. During his time on the north side, he was a two-time All-Star, the 2016 NLCS MVP, and won both a Gold Glove and a Silver Slugger.
Ernie Banks played his entire 19-year career with the Cubs, earning back-to-back MVP honors in 1958 and 1959. At the time of his retirement following the 1971 season, he ranked ninth all-time in career home runs with 512. He was elected to the Hall of Fame in 1977 and became a team ambassador, never seen without a smile on his face. Known as Mr. Cub, his #14 was retired by the team in 1982, making him the first Cub to receive that honor.
Bill Dahlen spent eight seasons with the Colts and Orphans through most of the 1890s. Playing in a dead ball era, he had a good amount of power, finishing among the NL’s top ten players in home runs four times and in slugging percentage three times. He set a new record with a 42-game hitting streak in 1894. He was traded away following the 1898 season. He is considered to have the most career WAR of any eligible player, except those tainted by scandal, to not be in the Hall of Fame.