 With Opening Day in the books, it is time to wrap up our tour of all of the baseball stadiums I’ve been to over the years with the ones I’ve been to the most: the homes of the Chicago White Sox. Between the two stadiums that have been located at the corners of 35th and Shields, I’ve seen at least 668 games, all but one of which have involved the White Sox. So, without further ado, let’s take a deeper look at my history with Comiskey Park and the facility currently known as Rate Field.
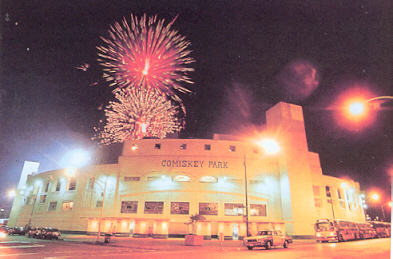
Stadium Name: Comiskey Park
Years in Service: 1910 – 1990
Visits: 13 (that I’m aware of)
Comiskey Park, the so-called Baseball Palace of the World, was the home of the White Sox from 1910 through the 1990 season. Built on a former city dump at the corner of 35th Street and Shields Avenue, the stadium opened on July 1, 1910, as the White Sox lost to the St. Louis Browns 2-0. The final game for the old ballyard occurred on September 30, 1990, a 2-1 victory over the Mariners.
Comiskey Park was the host for four World Series, including three in a row from 1917-1919. The White Sox won the World Series in 1917 against the New York Giants. The Cubs, looking for a larger seating capacity, moved their home games in the 1918 series against the Red Sox to Comiskey Park. The 1919 World Series, of course, was the Black Sox scandal, where the White Sox threw the series against the Reds. The White Sox returned to the World Series 40 years later in 1959 but fell to the Dodgers. The final post-season games to be played in Comiskey Park were games 3 and 4 of the 1983 ALCS, which the White Sox lost to the Baltimore Orioles.
Comiskey Park was also the host to three All-Star games. The first All-Star game, in 1933, was held in conjunction with Century of Progress Exposition being held on Chicago’s lakefront. The event returned to Chicago’s south side in 1950 and the final All-Star game at Comiskey Park was in 1983, the 50th anniversary of the first game. Comiskey Park was also the frequent home of the Negro League East-West All-Star Game from 1933 to 1960.
Looking back, I’ve now been able to piece together evidence of 13 games that I attended at Comiskey Park, either from pictures, stadium giveaways, or specific memories. I know there are more, but I have not been able to pinpoint exact games as of yet. The most memorable game I can remember would be the final night game, on September 29, 1990, where, after the game, the lights were symbolically turned off for the final time.

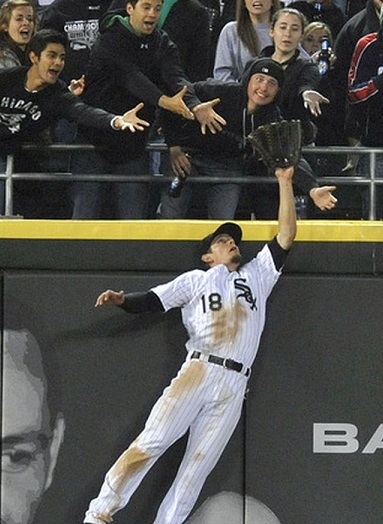
Stadium Name: Comiskey Park II/US Cellular Field/Guaranteed Rate Field/Rate Field
Years in Service: 1991 – Present
Visits: 655
On the evening of June 30, 1988, with the clock literally stopped, the Illinois legislature passed a bill that provided the financing for a new stadium for the White Sox, stopping them from moving to St. Petersburg, Florida. Two and a half years later, on April 18, 1991, Comiskey Park II opened, the first new major facility built in Chicago since the erection of the Chicago Stadium in 1929. Sadly, the White Sox were embarrassed by the Tigers, losing 16-0 in the opening of their new park.
Unfortunately for the White Sox, the new Comiskey Park was the last stadium to be built prior to the wave of retro ballparks that started with the opening of Camden Yards the following year. Because of this, there have been numerous renovations to the park, starting in 2001 with the addition of nearly 2000 seats and the relocation of the bullpens. More extensive renovations began in 2003 in preparation for that season’s All-Star Game and using the money generated from selling the naming rights to US Cellular, and continued through 2007, when the replacement of the blue seats with green seats was completed. Less extensive renovations have occurred since, replacing the different video boards and creating premium seating areas.
The post-season came to the new Comiskey Park for the first time in 1993, as the White Sox battled the Blue Jays in the ALCS. The stadium hosted its first World Series games in 2005, the first to be played in the city of Chicago since 1959, as the White Sox went on to sweep the Houston Astros and win their first World Series since 1917.
I attended my first game at the new Comiskey Park on April 20, 1991, the second game in the stadium’s history. Since then, I’ve been to 654 other games at the stadium, the majority coming from 2005 on, when I became a season ticket holder. I went to both games of the 2000 ALDS, which the White Sox lost to the Mariners, both games of the 2005 ALDS, which the White Sox won against the Red Sox, both games of the 2005 ALCS, which the White Sox split against the Angels, and game 2 of the 2005 World Series. I attended game 163 of the 2008 season to break the tie between the White Sox and the Twins. and then the two ALDS games against the Rays, the first time I saw the White Sox actually end a post-season series, either in victory or defeat.
Notable regular season games I’ve seen at what is now known as Guaranteed Rate Field include the September 18, 2001 game against the Yankees as baseball returned following the attacks of 9/11, the April 16, 2005 game where Mark Buehrle defeated the Mariners in 1 hour and 39 minutes, the April 2, 2006 season opener against the Indians when the World Series championship banner was raised, the April 4, 2006 game where the players received their World Series rings, and the September 16, 2007 game where Jim Thome hit his 500th career home run against the Angels. Not to mention a streak of 24 consecutive home openers.
 April 11, 2011 – A’s 2, White Sox 1
 May 9, 2015 – Reds 10, White Sox 4
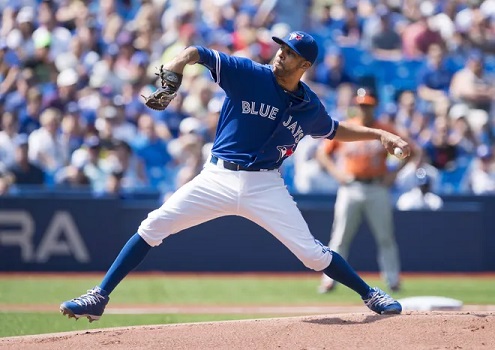 September 5, 2015 – Blue Jays 5, Orioles 1
 October 21, 2015 – Mets 8, Cubs 3
 October 22, 2016 – Cubs 5, Dodgers 0
 September 9, 2017 – White Sox 13, Giants 1