Last summer, the White Sox fell victim to Clayton Kershaw’s 3000th career strikeout and I decided to take a look back at the historic games I’ve attended over the years. Here is part two, featuring another six games where an individual hit a career plateau or a team clinched a division title or playoff series.
 July 20, 2008 – Royals 8, White Sox 7
Entering the Sunday afternoon skirmish with the Royals, Jim Thome sat two hits away from the 2000-hit plateau. A first inning RBI single brought him one step closer and, in the seventh inning, he reached the milestone, hitting a double down the left field line.
 September 14, 2008 – White Sox 4, Tigers 2
In the first game of a double header, Javier Vazquez took the mound for the White Sox, needing just five strikeouts to reach 2000 for his career. In the fifth inning, he retired Edgar Renteria swinging to reach the milestone. He finished the day with eight strikeouts, giving him 2003 for his career total.
 October 6, 2008 – Rays 6, White Sox 2
On a seasonably warm Monday afternoon, the White Sox looked to stay alive in the ALDS, trailing the Rays two games to one. Unfortunately, Gavin Floyd gave up four runs in his three innings of work, giving the Rays more than enough to close out the series, the first postseason series win in franchise history.
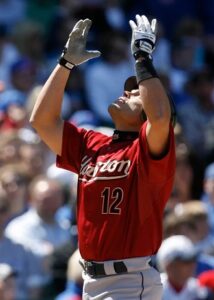 May 17, 2009 – Astros 6, Cubs 5
With the score tied at two in the top of the fourth inning at Wrigley Field, Astros catcher Ivan Rodriguez hit a shot off of Rich Harden, barely reaching the basket in left-center field for his 300th career home run. The blast gave the Astros a two-run lead, which they would not relinquish for the remainder of the afternoon.
 August 2, 2009 – Yankees 8, White Sox 5
On a gorgeous Sunday afternoon at US Cellular Field set up to be a pitcher’s duel between aces CC Sabathia and Mark Buehrle, Yankees outfielder Melky Cabrera stole the show, going 4-5 while hitting for the cycle. In the second inning, Cabrera went deep against Buehrle for a three-run shot, giving the Yankees an early lead. Leading off the fourth, he doubled to right field. The following inning, he hit single, driving in two more and ending Buehrle’s afternoon. Following a groundout in the sixth, Cabrera came up for the final time in the ninth against Scott Linebrink, hitting a triple into the right field corner and cementing his achievement.
 July 11, 2010 – White Sox 15, Royals 5
In the final game before the All-Star Break, with the White Sox leading 4-1, Andruw Jones came to the plate with two out to face Anthony Lerew while sitting on 399 home runs. With a 1-2 count, he deposited the next pitch into the White Sox bullpen for a three-run homer, the 400th of his career. He was just the 46th player in MLB history to reach this milestone.
 Previously, we’ve looked at the most recent time I’ve seen each of the 30 major league baseball teams play. Three weeks into the 2026 season, I thought it would be worth going into the wayback machine and see when the first time was that I saw each team live and in person, to the best of my knowledge. My records only go back to 1984, so anything before that is as yet unidentified.


 Monday, the BBWAA released their ballot for the Hall of Fame class of 2026. The results of the vote are due to be revealed on January 20th, with induction taking place July 26th. CC Sabathia, Ichiro Suzuki, and Billy Wagner were elected in last year’s voting, leaving fifteen holdovers along with another twelve newcomers.