 Originally founded in 1869, the Chicago Cubs became a charter member of the National League in 1876. Over the next 150 seasons, the Cubs have played more than 22,000 games, scored over 103,000 runs and recorded more than 200,000 hits, more than any other team in baseball history. Nearly 2,300 players have worn a Cubs uniform, earning eight division titles, 17 NL pennants, and three World Series championships.
Fans have witnessed generations of unforgettable players, from historical heroes like Joe Tinker, Gabby Hartnett, Ernie Banks, and Billy Williams to more recent stars like Ryne Sandberg, Derrek Lee, Kerry Wood, and Anthony Rizzo. The team has called Wrigley Field home for 110 of those 150 seasons.
To celebrate this milestone, the Cubs are holding a fan vote to select the franchise’s anniversary team. Each week, we will go through the provided options for each position and declare who should, and, if different, who will, win the fan vote. We continue today with the first eight selections for outfielder.
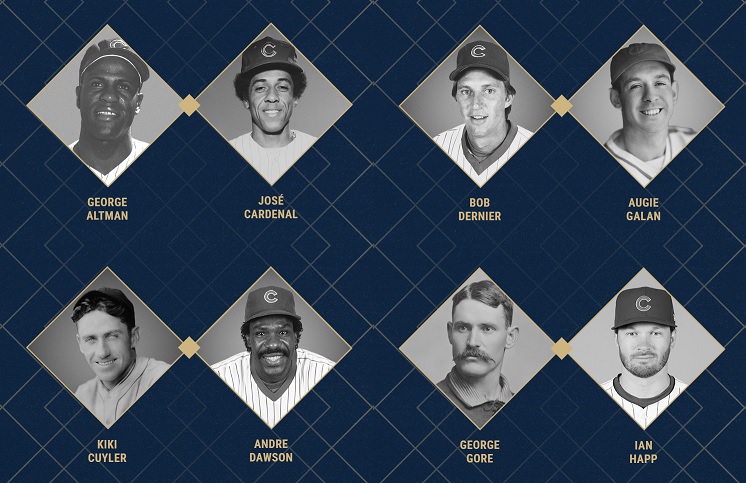 George Altman spent seven seasons with the Cubs across two stints. Debuting with the club in 1959, he quickly emerged as one of the team’s most productive hitters, earning All-Star selections in both 1961 and 1962. He accumulated 7.9 WAR across those two seasons while establishing himself as a dangerous power hitter. He returned to the Cubs in 1965 but was unable to reclaim his former status and struggled to produce. He finished his major league career in 1967, hitting just .111 in 15 games.
José Cardenal joined the Cubs for the 1972 season and stayed through 1977. He was one of the most popular and productive players during his tenure, bridging the gap between the superstars of the 60s and the success coming in the 1980s. He was named Cubs player of the year by local media in 1973. His best season came in 1975, earning 3.1 WAR while hitting .317. He was inducted into the Cubs Hall of Fame in 2022.
Kiki Cuyler joined the Cubs following the 1927 season and spent parts of eight years with the team. During his tenure, Cuyler was one of the most dynamic offensive players in the league, helping the Cubs win two NL pennants. He was named to his lone All-Star team in 1934 in its second year of existence. He led the NL in three times, from 1928 through 1930. In 1968, he was enshrined in Cooperstown as a member of the Hall of Fame.