#47 – Jon Garland

Name: Jon Garland

Rank: 47

Position: P

Years With White Sox: 2000-2007

Jon Garland was acquired by the White Sox at the trade deadline in 1998 from the Cubs in exchange for Matt Karchner.  He made his major league debut on July 4, 2000 against the Royals, becoming the youngest player in the American League and earning the loss by giving up 7 runs in 3 innings pitched at Kauffman Stadium.  He appeared in 15 games in the big leagues, 13 of them starts, and finished the year 4-8 with a 6.46 ERA as the White Sox won the AL Central.

Garland returned to the minor leagues to start the 2001 season, but was recalled in early May.  On May 12, he gave up the 200th home run of Alex Rodriguez’s career.  He split time between the rotation and the bullpen, ending the year with a 6-7 record and 3.69 ERA in 35 games.  He also notched his only career save.

In 2002, Garland joined the White Sox starting rotation full time.  He started 33 games and went a pedestrian 12-12 with a 4.58 ERA.  2003 was more of the same, as he went 12-13 with a 4.51 ERA.  He evened things out in 2004, going 12-11 with a 4.89 ERA, giving him a 3 year record of 36-36.

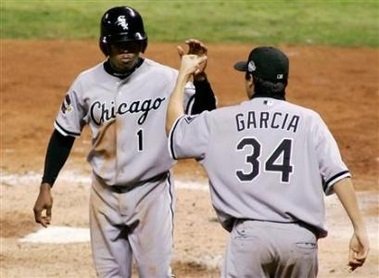
Things turned around in 2005, for both Garland and the White Sox.  He earned his first, and only, All Star nod, throwing a scoreless inning in relief.  He finished the year with an 18-10 record and a career low 3.50 ERA, helping the White Sox claim their first Central Division title since 2000.  Garland made his first post-season appearance in game 3 of the ALCS against the Angels, throwing a complete game in the 5-2 victory.  Garland appeared again in game 3 of the World Series, giving up 2 earned runs in 7 innings against the Astros.  He came in 6th place in Cy Young Award voting, right behind teammate Mark Buehrle.

Garland continued his winning ways in 2006, again winning 18 games while losing only 7, though his ERA rose to 4.51.  He also found success at the plate, hitting his first (and only) career home run on June 18 against the Reds.

2007 was another average year for Garland, as the White Sox cratered.  He finished the year 10-13 with a 4.23 ERA and completed his fourth straight year over 200 innings.  On November 19, he was traded to the Angels for shortstop Orlando Cabrera, ending his White Sox career.

Garland’s numbers in a White Sox uniform, both for games I attended and overall, were:

Continue reading →

Team Stats: Home Runs Surrendered

With 4 months until baseball in Chicago returns, I thought it would be interesting to look at the all time rankings in both offensive and defensive categories for all iterations of the current 30 teams for the 833 games I’ve identified that I have attended. We continue today on the defensive side of the ball with home runs surrendered.

Based on the raw numbers, the White Sox and Cubs are far and away the leaders in this category, as they are the teams I’ve seen the most.  When you adjust the numbers per game, the Expos jump to the top (or bottom, depending on your point of view) of the heap, with an even 2 home runs given up per game.  The Braves, Giants, Phillies, Diamondbacks, Miami Marlins, Nationals, and Devil Rays are the only teams below 1 home run per game.  The remaining teams fall in between.

Home Runs Surrendered
Team Name Home Runs Surrendered
Chicago White Sox 565
Chicago Cubs 399
Minnesota Twins 73
Kansas City Royals 51
Pittsburgh Pirates 49
Milwaukee Brewers 48
Cincinnati Reds 47
Houston Astros 47
Cleveland Indians 46
Detroit Tigers Continue reading →

Team Stats: Batting Average

With 4 months until baseball in Chicago returns, I thought it would be interesting to look at the all time rankings in both offensive and defensive categories for all iterations of the current 30 teams for the 833 games I’ve identified that I have attended.  We start today on the offensive side of the ball with team batting average.

The California Angels, who I only saw live and in person once, are the only team to post an average over .300.  The Washington Nationals, who, sadly, have had 8 games to make a mark, are the only team to post an average under .200.  In between, there is a slight correlation between the teams’ batting average and their record in these games, though with some surprising anomalies.

Batting Average
Team Name Batting Average
California Angels 0.306
Anaheim Angels 0.292
Arizona Diamondbacks 0.278
Tampa Bay Devil Rays 0.273
Cleveland Indians 0.271
Chicago Cubs 0.266
Colorado Rockies 0.265
Milwaukee Brewers 0.263
Kansas City Royals 0.261
Florida Marlins 0.260
Houston Astros 0.260
Chicago White Sox 0.259
Detroit Tigers Continue reading →

2017 Hall Of Fame Ballot – The Holdovers

baseballhofThe BBWAA released their ballot for the Hall of Fame class of 2017 on Monday. The results of the vote are due to be revealed on January 18th, with induction taking place next July. After Ken Griffey Jr. and Mike Piazza were elected in last year’s voting, the new ballot contains 15 holdovers along with 19 newcomers, which may continue the logjam caused by the current BBWAA rules which limit the number of votes on one ballot to 10 and the ongoing refusal by some writers to vote for players tainted by PEDs, leaving too many qualified candidates fighting for limited spots.

Let’s take a look at the returning candidates today before moving on to the newcomers.

Jeff Bagwell
Years on ballot: 6
2015 Percentage: 71.6

Bagwell was less than 4% away from induction last year and seems guaranteed to get elected this time around.

Barry Bonds
Years on ballot: 4
2015 Percentage: 44.3

The all time home run champion saw his vote percentage rise for the second straight time last year, so the PED bias holding him back may be subsiding.  Whether he has enough time to get up to 75% remains to be seen.

Roger Clemens
Years on ballot: 4
2015 Percentage: 45.2

Roger Clemens, he of the 354 career victories and 7 Cy Young awards, also found himself with a second consecutive rise after his fourth run through the voting process.  For some odd reason, perhaps by having played for more teams, Clemens continues to get marginally more support than his fellow PED poster child Barry Bonds.

Trevor Hoffman
Years on ballot: 1
2015 Percentage: 67.3

One of only 2 pitchers with over 600 saves, Hoffman came close to election on his first time on the ballot.  I would expect his to break through either this year or next.

Jeff Kent
Years on ballot: 3
2015 Percentage: 14.0

The 2000 NL MVP earned the exact same percentage of the vote as he did the previous year, meaning the future does not look good for him.

Edgar Martinez
Years on ballot: 7
2015 Percentage: 43.4

The longtime DH for the Mariners saw a big jump last year, but may not have enough time left on the ballot to build up to the necessary 75%.  His long career as a DH in the Pacific Northwest may be holding him back.

Fred McGriff
Years on ballot: 7
2015 Percentage: 20.9 Continue reading →

RIP US Cellular Field

uscellular-fieldYesterday, US Cellular Field officially was rechristened as Guaranteed Rate Field, ending a 14 year run for the wireless telecom company as the naming rights holder for the home of the Chicago White Sox.  In that time, I saw 414 games at the park, including a Marlins home game in 2004 due to Hurricane Ivan and post-season play in 2000, 2005 and 2008.

All-Time Team Records
TeamName Won Loss Winning Pctg
Arizona Diamondbacks 1 0 1.000
Colorado Rockies 2 0 1.000
St. Louis Cardinals 1 0 1.000
Florida Marlins 3 1 0.750
New York Yankees 10 7 0.588
Boston Red Sox 13 10 0.565
Los Angeles Angels 16 13 0.552
Baltimore Orioles 11 9 0.550
Chicago White Sox 223 190 0.540
Kansas City Royals 23 20 0.535
Toronto Blue Jays 9 8 0.529
Cleveland Indians 20 18 0.526
Tampa Bay Devil Rays 1 1 0.500
Tampa Bay Rays 8 8 0.500
Washington Nationals 1 1 0.500
Anaheim Angels 1 1 0.500
Cincinnati Reds 1 1 0.500
San Diego Padres 1 1 0.500
Houston Astros 4 5 0.444
Oakland Athletics 6 8 0.429
Chicago Cubs 11 15 0.423
Detroit Tigers 13 19 0.406
Minnesota Twins 19 28 0.404
Texas Rangers 7 13 0.350
Atlanta Braves 2 5 0.286
Seattle Mariners 5 18 0.217
Pittsburgh Pirates 1 4 0.200
Los Angeles Dodgers 1 5 0.167
Milwaukee Brewers 0 2 0.000
Montreal Expos 0 1 0.000
Miami Marlins 0 2 0.000

World Series Pitching Leaders

2016worldseriesFor the first time since 2005, the World Series returns to Chicago tonight as the Cubs face off against the Indians in game 3 with the Series knotted up at a game apiece.  Following up on Wednesday’s look at World Series offense, today we take a look at the pitching leaders from the 1 World Series game I’ve attended, game 2 of the 2005 World Series between the White Sox and the Astros at US Cellular Field.

Wins

Name Total
Neal Cotts 1

Losses

Name Total
Brad Lidge 1

ERA (> 2 IP)

Name Total
Andy Pettitte 3.00
Mark Buehrle 5.14

Strikeouts

Name Total
Mark Buehrle 6
Andy Pettitte 4
Cliff Politte 1
Bobby Jenks 1
Dan Wheeler 1

Appearances

Name Total
Mark Buehrle 1
Andy Pettitte 1
Cliff Politte 1
Bobby Jenks 1
Dan Wheeler 1
Mike Gallo 1
Neal Cotts 1
Chad Qualls 1
Brad Lidge 1

Saves

Name Total

World Series Batting Leaders

2005worldseriesLast night, the Cubs made their first World Series appearance since 1945 when they squared off against the Indians.  To mark the appearance, let’s look at the offensive leaders in the 1 World Series game I have attended, game 2 of the 2005 World Series between the White Sox and the Astros.

Home Runs

Name Total
Morgan Ensberg 1
Scott Podsednik 1
Paul Konerko 1

Hits

Name Total
Willy Taveras 2
Aaron Rowand 2
Brad Ausmus 2
Juan Uribe 2
Carl Everett 2

Runs

Name Total
Willy Tavares 2
11 tied with 1

RBI

Name Total
Paul Konerko 4
Lance Berkman 3
Jose Vizcaino 2
Joe Crede 1
Juan Uribe 1
Scott Podsednik 1
Morgan Ensberg 1

Doubles

Name Total
Juan Uribe 2
Lance Berkman 1
Continue reading →

All Time Playoff Team Records

baseballs3As the Cubs prepare for their second consecutive post-season appearance, it’s time to take an updated look at the team records for the now 20 playoff contests I have attended.  These contests come from the ALDS in 2000, 2005, and 2008, the NLDS in 2003, 2007, 2008, and 2015, the NLCS in 2003 and 2015, the ALCS in 2005, and, of course, the 2005 World Series.

Post-Season Team Records
Team Name Won Loss Winning Pctg
Florida Marlins 3 0 1.000
Seattle Mariners 2 0 1.000
New York Mets 2 0 1.000
Los Angeles Dodgers 2 0 1.000
Arizona Diamondbacks 1 0 1.000
Chicago White Sox 5 4 0.556
Tampa Bay Rays 1 1 0.500
Los Angeles Angels 1 1 0.500
Atlanta Braves 1 1 0.500
Chicago Cubs 2 9 0.182
St. Louis Cardinals 0 1 0.000
Houston Astros 0 1 0.000
Boston Red Sox 0 2 0.000

#66 – Willie Harris

wharrisName: Willie Harris

Rank: 66

Position: 2B/CF

Years With White Sox: 2002-2005

Willie Harris was acquired by the White Sox in January of 2002 from the Orioles in exchange for Chris Singleton.  Harris spent most of 2002 in Triple A Charlotte, but managed to appear in 49 games following the trade of Ray Durham.  In his extended audition, he hit .233 with 2 home runs and 12 RBI while stealing 8 bases without being caught.

Harris spent more time in Chicago during the 2003 season, but, despite appearing in 30 more games than the year before, his at bats decreased by 26.  He was mostly used as a defensive replacement in center field for Carl Everett.

2004 saw Harris getting his first extended opportunity to start, appearing in 129 games, starting 101 of them, and putting up the best numbers of his career.  He hit a career high .262 with 2 home runs and 27 RBI.

Following the acquisition of Tadahito Iguchi to take over second base, Harris split time between Chicago and Charlotte in 2005 for the first time since 2003.  He appeared in only 56 games for the White Sox, his lowest total since 2002.  He did, however, manage to make the playoff roster, as the White Sox reached post-season play for the first time since 2000.  Harris got only 2 at bats during the White Sox title run, but made the most of them with 2 hits and scoring the winning run in Game 4 of the World Series against the Astros.  Following the year, he became a free agent, ending his White Sox career.

Harris’ numbers in a White Sox uniform, both for games I attended and overall, were:

Continue reading →

All Time Team Records

baseballs3Another exciting baseball season is upon us, and it is time once again to look at the all-time team records for games that I have attended.  Despite disparate seasons on the two sides of town last season, both the White Sox and the Cubs saw their overall winning percentage drop.  The 2016 season looks to be hopeful for both teams, so this trend should reverse itself.

All-Time Team Records
TeamName Won Loss Winning Pctg
California Angels 1 0 1
Arizone Diamondbacks 13 2 0.866666666666667
Florida Marlins 15 8 0.652173913043478
Philadelphia Phillies 10 6 0.625
Toronto Blue Jays 12 8 0.6
New York Yankees 12 9 0.571428571428571
Colorado Rockies 7 6 0.538461538461538
Los Angeles Angels 15 13 0.535714285714286
San Francisco Giants 8 7 0.533333333333333
Chicago White Sox 250 222 0.529661016949153
Chicago Cubs 197 177 0.526737967914439
Detroit Tigers Continue reading →