Team Stats: Triples

With 3 months until baseball in Chicago returns, I thought it would be interesting to look at the all time rankings in both offensive and defensive categories for all iterations of the current 30 teams for the 833 games I’ve identified that I have attended. We continue today on the offensive side of the ball with triples.

Based on the raw numbers, the White Sox and Cubs are far and away the leaders in this category, as they are the teams I’ve seen the most.  When you adjust the numbers per game, the Brewers lead the way with a little more than 1 triple per every 4 games.  The Anaheim and California iterations of the Angels, the Miami version of the Marlins, and the Expos bring up the rear without a triple between them.

Triples
Team Name Triples
Chicago White Sox 69
Chicago Cubs 67
Cleveland Indians 11
Milwaukee Brewers 10
Detroit Tigers 9
Minnesota Twins 8
Baltimore Orioles 7
Houston Astros 7
Pittsburgh Pirates 6
Seattle Mariners Continue reading →

Team Stats: Strike Outs

With 2 months until baseball in Chicago returns, I thought it would be interesting to look at the all time rankings in both offensive and defensive categories for all iterations of the current 30 teams for the 833 games I’ve identified that I have attended. We continue today on the offensive side of the ball with strikeouts.

Based on the raw numbers, the White Sox and Cubs are far and away the leaders in this category, as they are the teams I’ve seen the most.  When you adjust the numbers per game, the Diamondbacks have a commanding lead with 9.6 strikeouts per game, the only team over 9.  Both the Cubs and the White Sox are in the bottom (or top, depending on your point of view) third, surprising given the number of at bats given to strikeout machines like Sammy Sosa, Jim Thome, and Adam Dunn.  The California iteration of the Angels have the low water mark with 4 strikeouts per game.

Strike Outs
Team Name Strike Outs
Chicago White Sox 3321
Chicago Cubs 2612
Minnesota Twins 410
Cleveland Indians 369
Kansas City Royals 363
Pittsburgh Pirates 349
Cincinnati Reds 342
Detroit Tigers 327
Houston Astros 317
Milwaukee Brewers Continue reading →

Team Stats: Saves

With 2 months until baseball in Chicago returns, I thought it would be interesting to look at the all time rankings in both offensive and defensive categories for all iterations of the current 30 teams for the 833 games I’ve identified that I have attended. We continue today on the defensive side of the ball with saves.

Based on the raw numbers, the White Sox and Cubs are far and away the leaders in this category, as they are the teams I’ve seen the most.  When you adjust the numbers per game, the California iteration of the Angels lead the way with an even 1 save per game.  At the bottom end of the spectrum are the Anaheim incarnation of the Angels, the Miami version of the Marlins, and the Devil Rays, who did not manage to earn a single save.

Saves
Team Name Saves
Chicago White Sox 112
Chicago Cubs 92
Kansas City Royals 17
Minnesota Twins 14
Toronto Blue Jays 12
Cincinnati Reds 11
New York Yankees 10
Detroit Tigers 10
Houston Astros 10
Los Angeles Angels Continue reading →

Team Stats: Walks

With 3 months until baseball in Chicago returns, I thought it would be interesting to look at the all time rankings in both offensive and defensive categories for all iterations of the current 30 teams for the 833 games I’ve identified that I have attended. We continue today on the offensive side of the ball with walks.

Based on the raw numbers, the White Sox and Cubs are far and away the leaders in this category, as they are the teams I’ve seen the most.  When you adjust the numbers per game, the California iteration of the Angels lead the way with an exceedingly high 9 walks per game.  8 teams averaged less than 3 walks per game, with the Miami version of the Marlins bringing up the rear with just 2.5.

Walks
Team Name Walks
Chicago White Sox 1543
Chicago Cubs 1202
Minnesota Twins 153
Cincinnati Reds 151
Pittsburgh Pirates 147
Cleveland Indians 144
Milwaukee Brewers 141
Houston Astros 133
Kansas City Royals 128
Detroit Tigers Continue reading →

Team Stats: Hit By Pitch

With 3 months until baseball in Chicago returns, I thought it would be interesting to look at the all time rankings in both offensive and defensive categories for all iterations of the current 30 teams for the 833 games I’ve identified that I have attended. We continue today back on the defensive side of the ball with batters hit by a pitch.

Again, based on the raw numbers, the White Sox and Cubs are far and away the leaders in this category, as they are the teams I’ve seen the most. When you adjust the numbers per game, the Devil Rays lead, followed, surprisingly, by the Tigers, who hit a little more than 1 batter every other game.  The Phillies and the Braves are at the bottom, hitting less than 1 batter every 15 games, while the Mets have yet to hit a batter in a game I’ve seen.

Hit By Pitch
Team Name Hit By Pitch
Chicago White Sox 149
Chicago Cubs 125
Minnesota Twins 21
Detroit Tigers 21
Kansas City Royals 17
Cincinnati Reds 16
Cleveland Indians 16
Texas Rangers 14
Houston Astros 14
Pittsburgh Pirates Continue reading →

Team Stats: Stolen Bases

With 3 months until baseball in Chicago returns, I thought it would be interesting to look at the all time rankings in both offensive and defensive categories for all iterations of the current 30 teams for the 833 games I’ve identified that I have attended. After a brief hiatus for the holidays, we continue today back on the offensive side of the ball with stolen bases.

Based on the raw numbers, the White Sox and Cubs are far and away the leaders in this category, as they are far and away the teams I’ve seen the most. When you adjust the numbers per game, the California and Anaheim versions of the Angels and the Devil Rays jump to the top of the heap.  The White Sox fall to the bottom of the middle third and the Cubs are squarely towards the low end, with less than 1 SB every other game.  The Braves are the worst team that I have seen somewhat often, at less than .3 SB per game, while the Miami incarnation of the Marlins have yet to steal a base in a game I have attended.

Stolen Bases
Team Name Stolen Bases
Chicago White Sox 303
Chicago Cubs 176
Kansas City Royals 36
Milwaukee Brewers 34
Cincinnati Reds 32
Houston Astros 30
Texas Rangers 28
Minnesota Twins 27
Cleveland Indians 26
Detroit Tigers Continue reading →

Team Stats: Home Runs Surrendered

With 4 months until baseball in Chicago returns, I thought it would be interesting to look at the all time rankings in both offensive and defensive categories for all iterations of the current 30 teams for the 833 games I’ve identified that I have attended. We continue today on the defensive side of the ball with home runs surrendered.

Based on the raw numbers, the White Sox and Cubs are far and away the leaders in this category, as they are the teams I’ve seen the most.  When you adjust the numbers per game, the Expos jump to the top (or bottom, depending on your point of view) of the heap, with an even 2 home runs given up per game.  The Braves, Giants, Phillies, Diamondbacks, Miami Marlins, Nationals, and Devil Rays are the only teams below 1 home run per game.  The remaining teams fall in between.

Home Runs Surrendered
Team Name Home Runs Surrendered
Chicago White Sox 565
Chicago Cubs 399
Minnesota Twins 73
Kansas City Royals 51
Pittsburgh Pirates 49
Milwaukee Brewers 48
Cincinnati Reds 47
Houston Astros 47
Cleveland Indians 46
Detroit Tigers Continue reading →

Team Stats: Batting Average

With 4 months until baseball in Chicago returns, I thought it would be interesting to look at the all time rankings in both offensive and defensive categories for all iterations of the current 30 teams for the 833 games I’ve identified that I have attended.  We start today on the offensive side of the ball with team batting average.

The California Angels, who I only saw live and in person once, are the only team to post an average over .300.  The Washington Nationals, who, sadly, have had 8 games to make a mark, are the only team to post an average under .200.  In between, there is a slight correlation between the teams’ batting average and their record in these games, though with some surprising anomalies.

Batting Average
Team Name Batting Average
California Angels 0.306
Anaheim Angels 0.292
Arizona Diamondbacks 0.278
Tampa Bay Devil Rays 0.273
Cleveland Indians 0.271
Chicago Cubs 0.266
Colorado Rockies 0.265
Milwaukee Brewers 0.263
Kansas City Royals 0.261
Florida Marlins 0.260
Houston Astros 0.260
Chicago White Sox 0.259
Detroit Tigers Continue reading →

RIP US Cellular Field

uscellular-fieldYesterday, US Cellular Field officially was rechristened as Guaranteed Rate Field, ending a 14 year run for the wireless telecom company as the naming rights holder for the home of the Chicago White Sox.  In that time, I saw 414 games at the park, including a Marlins home game in 2004 due to Hurricane Ivan and post-season play in 2000, 2005 and 2008.

All-Time Team Records
TeamName Won Loss Winning Pctg
Arizona Diamondbacks 1 0 1.000
Colorado Rockies 2 0 1.000
St. Louis Cardinals 1 0 1.000
Florida Marlins 3 1 0.750
New York Yankees 10 7 0.588
Boston Red Sox 13 10 0.565
Los Angeles Angels 16 13 0.552
Baltimore Orioles 11 9 0.550
Chicago White Sox 223 190 0.540
Kansas City Royals 23 20 0.535
Toronto Blue Jays 9 8 0.529
Cleveland Indians 20 18 0.526
Tampa Bay Devil Rays 1 1 0.500
Tampa Bay Rays 8 8 0.500
Washington Nationals 1 1 0.500
Anaheim Angels 1 1 0.500
Cincinnati Reds 1 1 0.500
San Diego Padres 1 1 0.500
Houston Astros 4 5 0.444
Oakland Athletics 6 8 0.429
Chicago Cubs 11 15 0.423
Detroit Tigers 13 19 0.406
Minnesota Twins 19 28 0.404
Texas Rangers 7 13 0.350
Atlanta Braves 2 5 0.286
Seattle Mariners 5 18 0.217
Pittsburgh Pirates 1 4 0.200
Los Angeles Dodgers 1 5 0.167
Milwaukee Brewers 0 2 0.000
Montreal Expos 0 1 0.000
Miami Marlins 0 2 0.000

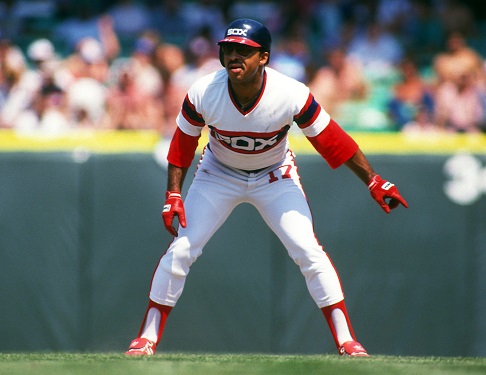
#61 – Jerry Hairston

jerry-hairston

Name: Jerry Hairston

Rank: 61

Position: OF

Years With White Sox: 1973-1977,1981-1989

Jerry Hairston was selected by the White Sox in the 3rd round of the 1970 draft.  He made his major league debut on July 26, 1973 in the second game of a double header, going 1-4 in a 1-0 loss to the Royals in Kansas City.  Hairston appeared in 60 games for 1973 squad, hitting .271 with 23 RBI.

Hairston split the 1974 season between Triple A and Chicago, appearing in 45 games for the White Sox and hitting a disappointing .229.  1975 again saw Hairston splitting time between the minors and the big league team, appearing in 69 games and improving his average to .283.  1976 was another down year for Hairston, as his average dropped back to .227 in only 44 games for the White Sox.

Hairston played in only 13 games for the White Sox in 1977 before being purchased by the Pirates on June 13.  After 4 seasons in the Mexican League, Hairston rejoined the White Sox in September of 1981.  He appeared in 9 games and hit .280, including his first home run in a White Sox uniform.

Hairston spent the entire 1982 season on the south side for the first time, appearing in 85 games and hitting a disappointing .233 while setting a career high with 5 home runs.  1983 was a bounce back year for Hairston, who raised his average to .294 with another 5 home runs.  He appeared in 2 games during the ALCS loss to the Orioles, going hitless in 3 at bats.

1984 was a disappointing year for the White Sox as they failed to repeat as Western Division champs, but Hairston saw the most playing time of his career.  He set career highs in games played and at bats, hitting .260.  Hairston struggled in 1985, as he saw his average drop to .243 in 95 games.  1986 was another bounce back year, as Hairston improved his average to .271 and tied his career high in home runs for the 4th time.

Hairston had another down year in 1987, appearing in just 66 games and hitting .230, his worst numbers since returning from Mexico.  As spring training was winding down in 1988, Hairston was released, but he was resigned at the end of August and appeared in 2 games over the final month of the season, going hitless in 2 at bats.  He was released again following the season and, once again, resigned with the White Sox in September of 1989, appearing in 3 games and getting 1 hit in 3 at bats.  He was released again following the season and his career came to an end.

Hairston’s numbers in a White Sox uniform, both for games I attended and overall, were:

Continue reading →