 With 4 months until baseball in Chicago returns, I thought it would be interesting to look at the all time rankings in both offensive and defensive categories for all iterations of the current 30 teams for the 833 games I’ve identified that I have attended. We start today on the offensive side of the ball with team batting average.
The California Angels, who I only saw live and in person once, are the only team to post an average over .300. The Washington Nationals, who, sadly, have had 8 games to make a mark, are the only team to post an average under .200. In between, there is a slight correlation between the teams’ batting average and their record in these games, though with some surprising anomalies.
| Team Name | Batting Average |
|---|---|
| California Angels | 0.306 |
| Anaheim Angels | 0.292 |
| Arizona Diamondbacks | 0.278 |
| Tampa Bay Devil Rays | 0.273 |
| Cleveland Indians | 0.271 |
| Chicago Cubs | 0.266 |
| Colorado Rockies | 0.265 |
| Milwaukee Brewers | 0.263 |
| Kansas City Royals | 0.261 |
| Florida Marlins | 0.260 |
| Houston Astros | 0.260 |
| Chicago White Sox | 0.259 |
| Detroit Tigers Continue reading → |


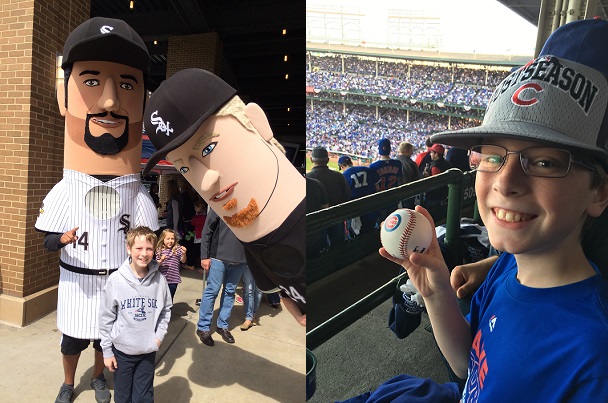 We finish off the year with 2 shots of Michael from 2 different baseball games in 2 different stadiums. On the left, he is posing with the retro racers of Paul Konerko and Joe Crede on the concourse at US Cellular Field early in the 2015 season. On the right, he is showing off the baseball he got from Tom Ricketts at Wrigley Field during the 2015 post-season.