Looking Ahead To Next Year

baseballs3Major League Baseball released their tentative 2018 schedule last week.  While the local squads have differing goals in mind as 2017 winds down, with the Cubs looking to repeat as World Series champions and the White Sox playing out the string in year one of their rebuild, it’s time to turn our attention to next summer for both teams.

The White Sox open their season on the road in Kansas City on March 29 against the Royals, and then open the home portion of the campaign a week later against the Tigers.

The interleague schedule pits the White Sox against the NL Central, with trips to St. Louis, Pittsburgh, and Cincinnati and home series against the Pirates, Cardinals, and the Brewers.  The rivalry with their north side foes continues with a 3 game series at Wrigley Field in May and then moving back to the south side in late September.

The season ends with a 6 game homestand against the Cubs and Indians before heading to Minnesota for the final weekend.  Year two of the rebuild can see the White Sox playing spoiler down the stretch.

Meanwhile, on the north side, the Cubs open the season down in Miami on March 29.  They kick off the home portion of their schedule on April 9 against the Pirates.

The interleague schedule pits the Cubs against the AL Central, with trips to Cleveland, Kansas City, and Detroit and home series against the Indians, Twins, and the Tigers.

The Cubs end the year with a 7 game homestand against the Pirates and the Cardinals, likely challengers for the NL Central crown.
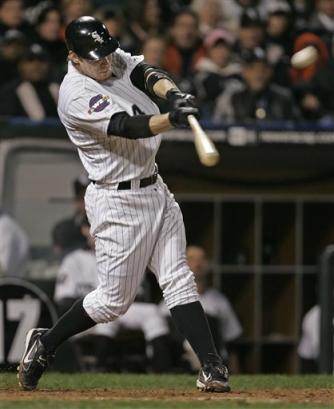
#14 – Joe Crede

Name: Joe Crede

Rank: 14

Position: 3B

Years With White Sox: 2000-2008

Joe Crede joined the White Sox organization as their 5th round selection in the 1996 draft.  He earned a September call-up from Double A in 2000, and made his major league debut on September 12, replacing Herbert Perry and going 0-1 in the Tigers 10-3 victory at Comiskey Park.  Crede appeared in 7 games, making the most of his 14 at bats, and finished with a .357 average.

Crede was sent to Charlotte for the 2001 season, again getting a cup of coffee with the big league club in September.  With the White Sox not heading to the post-season, Crede got a little more playing time, but was less successful than the year before.  He finished with a .220 average in 50 at bats over 17 games.

2002 saw Crede return to Triple A, before being recalled to the White Sox for good in July.  On August 12, he hit his first major league home run off of former teammate James Baldwin.  “He was someone who always got on me for being a rookie in the clubhouse and on the bus last year,” Crede said.  “Singing on the bus and stuff.  Nothing very harmful, but it was a good way to get him back.”  In 53 games, Crede finished with 12 home runs, 35 RBIs, and a .285 average.

Crede established himself as the starting third baseman in 2003.  He appeared in a career high 151 games and launched 19 home runs with 75 RBIs while posting a .261 average.  He struggled in 2004, seeing his average drop to .239 while hitting 21 home runs with 69 RBIs.

In 2005, Crede started to come in to his own.  While he improved his average to .252 and hit 22 home runs with 62 RBIs, he started to come in to his own in the second half, culminating with a game winning, and possible season saving, home run in the 10th inning against the Indians on September 20, which pushed the White Sox to a 3.5 game lead and propelled them into the playoffs.  Crede had a rough series in the ALDS against the Red Sox, getting only 1 hit in 9 at bats, but rebounded in the ALCS and World Series, hitting .368 and .294 respectively, with 2 home runs in each series.

2006 was Joe Crede’s breakout season.  He hit .283 with career highs in home runs, with 30, and RBIs, with 94.  Following the season, he was awarded his first, and only, Silver Slugger award.

Crede looked to continue his new found dominance at the hot corner in 2007, but a back injury limited him to 47 games and only 4 home runs.  He returned with a bang in 2008, hitting a grand slam on opening day against the Twins.  A good first half saw him earn his first All Star selection, but the back injury recurred and kept him out for most of the second half of the season, including the playoffs.   Crede became a free agent at the end of the year and his White Sox career came to an end.

Crede’s numbers in a White Sox uniform, both for games I attended and overall, were:

Continue reading →

#19 – Greg Luzinski

Name: Greg Luzinski

Rank: 19

Position: DH

Years With White Sox: 1981-1984

With a new ownership group in place and looking to make a splash, the White Sox purchased Greg Luzinski from the Phillies on March 30, 1981.  Coming off a disappointing season, the Chicago-area native responded well to the change, hitting .265 with 21 home runs in the strike-shortened season.  He earned Comeback Player of the Year honors, beating out teammate Bill Almon by 5 votes, and finished 23rd in MVP voting.

Luzinski had another strong year in 1982.  He raised his average to .292, his highest total since 1977, while hitting 18 home runs and driving in 102 runs.

In 1983, Luzinski was a powerful cog in leading the White Sox to their first division title.  He launched the 8th, 9th, and 10th rooftop home runs in Comiskey Park history between June 26 and August 28.  While his average dropped to .255, he hit 32 home runs and drove in 95, good enough to finish 17th in MVP voting.  Like the rest of his teammates, he struggled during the ALCS against the Orioles, hitting only .133 in the 4 game series.

Those struggles carried over in to 1984.  His average dropped again, to .238, and his power output fell as well.  He finished the year with only 13 home runs, his lowest total since 1974, and 58 RBIs, though he did manage to hit his fourth rooftop blast on July 3 against the Tigers.  He became a free agent following the year and decided to retire.

Luzinski’s numbers in a White Sox uniform, both for games I attended and overall, were:

Continue reading →

2017 All Star Break Standings

As the baseball world turns its sights to Miami for Tuesday night’s All Star Game, it’s time to take a look at the team records for the 24 games I attended in the first half of the baseball season, a mish-mash of excitement, followed by disappointment, giving way to uncertainty about what the second half will hold.

2017 Team Records
Team Name Won Loss Winning Pctg
Oakland Athletics 2 0 1.000
Pittsburgh Pirates 1 0 1.000
Milwaukee Brewers 1 0 1.000
Colorado Rockies 1 0 1.000
New York Yankees 2 1 0.667
Chicago White Sox 9 8 0.529
Detroit Tigers 2 2 0.500
Texas Rangers 1 1 0.500
Minnesota Twins 1 1 0.500
Los Angeles Dodgers 1 1 0.500
Cleveland Indians 1 1 0.500
Boston Red Sox 1 1 0.500
Chicago Cubs 1 6 0.143
San Diego Padres 0 1 0.000
Kansas City Royals 0 1 0.000

It’s Been A While

Prior to last night’s game, I hadn’t seen the Rockies live since August of 2012, nearly 5 years ago.  For someone with season tickets to two teams, one in each league, that is a long drought.  This got me thinking about the other 29 teams.

You would think that I would cycle through each team every few years or so.  And, for the most part, that does seem to be the case.  I’ve already seen 12 teams in 2017, and the season is just over 2 months old.  Going back to last year, that number jumps to 22 and, going back to 2015, 25.  That’s over 83% of the league in the past 2+ seasons.

What about those remaining 5 teams?  The Astros and Diamondbacks last appeared in 2014, with the Marlins and the Nationals in the two years prior.  That leaves the Phillies, who I have somehow not managed to see in person since 2009.  I’ve seen the Florida Marlins more recently.  Anyway, here’s a look at each team and the last time I saw them play.

Team Name Date
Colorado Rockies 6/8/2017
Chicago Cubs 6/8/2017
Chicago White Sox 5/30/2017
Boston Red Sox 5/30/2017
Detroit Tigers 5/28/2017
San Diego Padres 5/13/2017
New York Yankees 5/7/2017
Kansas City Royals 4/25/2017
Cleveland Indians 4/23/2017
Pittsburgh Pirates 4/15/2017
Los Angeles Dodgers 4/12/2017
Minnesota Twins 4/9/2017
San Francisco Giants 10/8/2016
Continue reading →

Fitbit III: Week 17

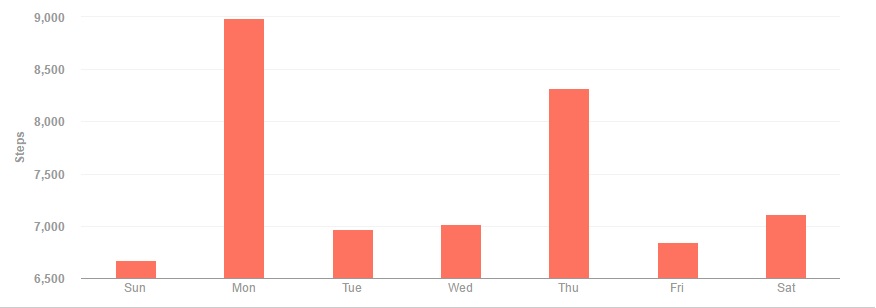
Another week back over 50,000 steps and another week with all 7 days above goal, running my total to 17.  Things got off to a decent start on Sunday, thanks to trips to 2 grocery stores.  The work week started with 3 days of training, which had me working from home, which is normally a problem.  Good weather on Monday let me take an after work walk which led to the highest day of the week.  Tuesday and Wednesday both suffered from rain, so they did not get as high.  Thursday was back in the office, and I somehow managed to surpass 8000 steps.  Friday was the kickoff to the long weekend, and I managed to just surpass my daily goal.  Saturday had a double header at Guaranteed Rate Field, where I was able to cross the 7000 step plateau while taking in the split between the White Sox and the Tigers.

Total steps: 51,919

Daily average: 7417

All Time Team Records

baseballs3Yet another exciting baseball season is upon us, and it is time once again to look at the all-time team records for games that I have attended dating back to 1984.  The Cubs begin the season as defending champions for the first time since 1909 while the White Sox finally start their long-overdue rebuilding effort, so both sides of town are pointing in different directions.  Either way, the 2017 season should be an exciting one.

All-Time Team Records
Team Name Won Loss Winning Pctg
California Angels 1 0 1.000
Arizona Diamondbacks 13 2 0.867
Florida Marlins 15 8 0.652
Philadelphia Phillies 10 6 0.625
Toronto Blue Jays 13 9 0.591
New York Yankees 12 9 0.571
Los Angeles Angels 16 13 0.552
Boston Red Sox 14 12 0.538
Colorado Rockies 7 6 0.538
Chicago Cubs 203 179 0.531
Chicago White Sox 267 237 0.530
Cleveland Indians 23 21 0.523
Kansas City Royals Continue reading →

2017 Predictions

The 2017 baseball season is scheduled to kick off tonight, with 3 games scheduled culminating with the Cubs starting their first title defense since 1909 against their arch rivals in St. Louis.  For the seventh consecutive year, I’ve looked into the crystal ball to make my picks for the upcoming season.

American League

East: Red Sox

Central: Indians

West: Mariners

Wild Cards: Blue Jays, Tigers

AL Champion: Red Sox

Cy Young: Chris Sale

MVP: Francisco Lindor

National League

Continue reading →

Team Stats: Home Run

With 1 week until baseball in Chicago returns, I thought it would be interesting to look at the all time rankings in both offensive and defensive categories for all iterations of the current 30 teams for the 833 games I’ve identified that I have attended. We finish up today on the offensive side of the ball with home runs.

As you might expect by this point, the White Sox and Cubs, based on the raw numbers, are far and away the leaders in this category, as they are the teams I’ve seen the most.  When you adjust the numbers per game, the California incarnation of the Angels and the Diamondbacks are the only teams at or above 2 home runs per game.  The Nationals and the Anaheim version of the Angels are the only teams with less than a home run every other game.

Home Runs
Team Name Home Runs
Chicago White Sox 605
Chicago Cubs 437
Cleveland Indians 53
Kansas City Royals 48
Detroit Tigers 45
Minnesota Twins 44
Houston Astros 40
Texas Rangers 40
Milwaukee Brewers 39
Seattle Mariners Continue reading →

Team Stats: Earned Run Average

With 2 weeks until baseball in Chicago returns, I thought it would be interesting to look at the all time rankings in both offensive and defensive categories for all iterations of the current 30 teams for the 833 games I’ve identified that I have attended. We continue today on the defensive side of the ball with earned run average.

Both the White Sox and Cubs are in the top half for team ERA, at 4.10 and 3.97 respectively.  The Anaheim iteration of the Angels lead the way at just under 2.60.  Their earlier counterparts from California are on the opposite end of the spectrum, clocking in at an even 6.00.

Earned Run Average
Team Name ERA
Anaheim Angels 2.59620377314948
Arizona Diamondbacks 2.77443609022556
San Francisco Giants 2.91412259138847
Montreal Expos 3.4000755572346
Los Angeles Angels 3.58378597800244
Philadelphia Phillies 3.69343107010444
Washington Nationals 3.74644733442425
Boston Red Sox 3.87378352436825
Miami Marlins 3.9375
Oakland Athletics Continue reading →