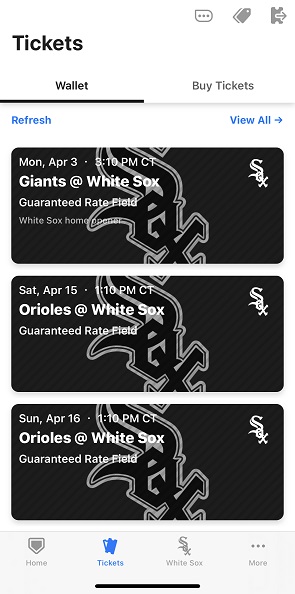
 This was a much more exciting day back when the White Sox delivered physical tickets for non-premium season ticket holders, but season tickets have been uploaded to the MLB Ballpark app. While this does make the actual game day use of the tickets more convenient, I can’t help but miss the old days of paper tickets and getting a big, fancy box filled with tickets in the mail.
Category / Baseball
Team Stats: Games Per Team
 Today, we wrap up our look at the all-time rankings for all iterations of the current 30 teams for the 1040 games I’ve identified that I have attended. Opening Day is just under two months away and spring training camps are getting ready to roll in just a week or two, so let’s finish things off with the total number of games per team.
With the newly unbalanced schedule starting this year, the Central Division in each league will not score as heavily going forward. In fact, you have to drop down to seventh place in the current rankings to find a team not in the Central Division and to tenth place to find the first team that was never in the Central. The addition of expanded interleague play should also shake things up a bit moving forward.
Games Per Team
| Team Name | Total Games |
|---|---|
| Chicago White Sox | 672 |
| Chicago Cubs | 437 |
| Minnesota Twins | 68 |
| Kansas City Royals | 62 |
| Detroit Tigers | 59 |
| Cleveland Indians | 58 |
| Houston Astros | 49 |
| Pittsburgh Pirates | 46 |
| Milwaukee Brewers | 41 |
| Seattle Mariners | 40 |
| Cincinnati Reds | 40 |
| Texas Rangers | 39 |
| Baltimore Orioles | 36 |
| Los Angeles Angels | 35 |
| St. Louis Cardinals Continue reading → |
Team Stats: Home Runs
 It will be two months until baseball returns to Chicago, so I thought it would be a good time to revisit, for the first time in six years, the all-time rankings in both offensive and defensive categories for all iterations of the current 30 teams for the 1040 games I’ve identified that I have attended. We continue today on the offensive side of the ball with home runs.
As you might expect by this point, the White Sox and Cubs, based on the raw numbers, are far and away the leaders in this category, as they are, as always, the teams I’ve seen most often. When you adjust the numbers per game, the California incarnation of the Angels and the Guardians are the only teams at or above two home runs per game. The Nationals and the Anaheim version of the Angels are the only teams with less than a home run every other game.
Home Runs
| TeamName | TotalTriples |
|---|---|
| Chicago White Sox | 811 |
| Chicago Cubs | 498 |
| Cleveland Indians | 72 |
| Kansas City Royals | 68 |
| Detroit Tigers | 66 |
| Minnesota Twins | 65 |
| Seattle Mariners | 58 |
| Texas Rangers | 49 |
| Boston Red Sox | 49 |
| Houston Astros | 48 |
| Milwaukee Brewers | 45 |
| New York Yankees | 44 |
| St. Louis Cardinals | 42 |
| Oakland Athletics | 42 |
| Baltimore Orioles Continue reading → |
Party Of One
 The baseball world had turned its attention to snowy hamlet of Cooperstown in upstate New York, where the votes were tallied and the 2023 Hall of Fame class is now complete with one additional member. Former Phillies and Cardinals third baseman Scott Rolen scored 76.3% of the vote to earn enshrinement in his sixth election.
Four others tallied greater than 50% of the vote, led by Todd Helton, who jumped up to 72.2% and seems like a lock to be elected next year. Billy Wagner came in with 68.1% and has two more attempts to make it over 75%. Andruw Jones got a big lift, jumping up to 58.1%. Finally, Gary Sheffield, with just one election left, rises to 55% and looks unlikely to make that final jump in his last year.
On the local front, Manny Ramirez, who spent a little more than a month with the White Sox, saw a small increase in support, finishing with 33.2% of the vote thanks to his multiple PED suspensions. The disgraced Omar Vizquel, accused of both sexual abuse of an autistic teen and spousal abuse since being added to the ballot, dropped even more, down to 19.5%. Jimmy Rollins, who spent the final 41 games of his career on the south side, picked up 12.9% in his second go-around. Mark Buehrle jumped back up to 10.8% in his third time on the ballot, living to fight another day. Former Cub pitcher John Lackey nabs a single vote.
Thirteen players will fall off the ballot after failing to score 5% of the vote.
As for the newest Hall of Famer, I’ve seen Rolen play 18 times. He joins Fred McGriff, who was elected by the veteran’s committees in December, in the class of 2023. They will both get their day in the sun on Sunday, July 23.
Scott Rolen’s numbers in games I’ve attended were:
Team Stats: Earned Run Average
With less than three months until baseball returns to Chicago, I thought it would be a good time to revisit, for the first time in six years, the all-time rankings in both offensive and defensive categories for all iterations of the current 30 teams for the 1040 games I’ve identified that I have attended. We wrap up the defensive side of the ball today with earned run average.
Both the White Sox and Cubs find themselves in the middle of the pack for team ERA, with the Cubs coming in at 14th with 4.00 and the White Sox at 17th with a team ERA of 4.20. The Anaheim iteration of the Angels lead the way, finishing mere percentage points below 2.60. The Devil Rays are on the opposite end of the spectrum, clocking in just over 5.95.
Earned Run Average
| Team Name | ERA |
|---|---|
| Anaheim Angels | 2.59620377314948 |
| Arizona Diamondbacks | 2.92054914270955 |
| Washington Nationals | 3.16720186512999 |
| Montreal Expos | 3.4000755572346 |
| Los Angeles Dodgers | 3.41129032258065 |
| Colorado Rockies | 3.58507711650256 |
| Los Angeles Angels | 3.65023417507605 |
| San Francisco Giants | 3.69195184152779 |
| Boston Red Sox | 3.70899413615711 |
| Oakland Athletics | 3.84286934244236 |
| Tampa Bay Rays | 3.87647371109753 |
| Miami Marlins | 3.9375 |
| Philadelphia Phillies | 3.96004525766009 |
| Chicago Cubs | 3.99524314872638 |
| New York Mets Continue reading → |
Team Stats: Runs Batted In
 It will be less than three months until baseball returns to Chicago, so I thought it would be a good time to revisit, for the first time in six years, the all-time rankings in both offensive and defensive categories for all iterations of the current 30 teams for the 1040 games I’ve identified that I have attended. We continue today on the offensive side of the ball with runs batted in.
Based on the raw numbers, the White Sox and Cubs are far and away the leaders in this category, as they are the teams I’ve seen most often. When you adjust the numbers per game, the California iteration of the Angels and the Guardians lead the way as the only teams over seven. The Nationals and the Miami incarnation of the Marlins are the only teams that failed to average three runs batted in per game.
Runs Batted In
| Team Name | RBIs |
|---|---|
| Chicago White Sox | 2943 |
| Chicago Cubs | 1899 |
| Cleveland Indians | 286 |
| Minnesota Twins | 261 |
| Kansas City Royals | 247 |
| Detroit Tigers | 247 |
| Houston Astros | 221 |
| Milwaukee Brewers | 194 |
| Texas Rangers | 182 |
| Boston Red Sox | 174 |
| Pittsburgh Pirates | 172 |
| Cincinnati Reds | 169 |
| Seattle Mariners | 161 |
| New York Yankees | 160 |
| Baltimore Orioles | 148 |
| Los Angeles Angels | 137 |
| St. Louis Cardinals | 135 |
| Los Angeles Dodgers | 126 |
| Oakland Athletics | 124 |
| Florida Marlins | 120 |
| Toronto Blue Jays | 115 |
| Arizona Diamondbacks | 101 |
| Tampa Bay Rays | 96 |
| Atlanta Braves | 85 |
| Philadelphia Phillies | 79 |
| San Diego Padres | 76 |
| San Francisco Giants | 76 |
| New York Mets | 71 |
| Colorado Rockies | 64 |
| Washington Nationals | 40 |
| Tampa Bay Devil Rays | 32 |
| Cleveland Guardians | 22 |
| Montreal Expos | 19 |
| California Angels | 15 |
| Anaheim Angels | 7 |
| Miami Marlins | 4 |
Runs Batted In per Game
| Team Name | RBIs per Game |
|---|---|
| California Angels | 7.5 |
| Cleveland Guardians | 7.33333333333333 |
| Tampa Bay Devil Rays | 6.4 |
| Arizona Diamondbacks | 5.94117647058824 |
| Boston Red Sox | 5.4375 |
| Florida Marlins | 5.21739130434783 |
| New York Yankees | 5.16129032258065 |
| Cleveland Indians | 4.93103448275862 |
| Milwaukee Brewers | 4.73170731707317 |
| Texas Rangers | 4.66666666666667 |
| Houston Astros | 4.51020408163265 |
| Chicago White Sox | 4.37946428571429 |
| Chicago Cubs | 4.34553775743707 |
| Los Angeles Dodgers | 4.3448275862069 |
| Toronto Blue Jays | 4.25925925925926 |
| Cincinnati Reds | 4.225 |
| Detroit Tigers | 4.1864406779661 |
| New York Mets | 4.17647058823529 |
| Tampa Bay Rays | 4.17391304347826 |
| Baltimore Orioles Continue reading → |
F*ck Cancer
 White Sox closer Liam Hendriks announced last night that he had recently been diagnosed with non-Hodgkins’s lymphoma and would begin treatment this week. A team statement from general manager Rick Hahn said that they do not expect to have any updates on his playing status prior to Opening Day.
This is a big blow for the White Sox, both on the field and off. Hendriks, 33, has saved 75 games over the past two seasons, helping to stabilize the bullpen. Off the field, he’s considered a team leader who, along with his wife, has become extremely active in charitable causes throughout the Chicago area.
Hopefully, Hendriks takes well to the medication and is able to beat this cancer fully. The baseball will take care of itself.
Team Stats: Strike Outs
 The new year means there is less than three months until baseball returns to Chicago. I thought it would be a good time to revisit, for the first time in six years, the all-time rankings in both offensive and defensive categories for all iterations of the current 30 teams for the 1040 games I’ve identified that I have attended. After a break for the holidays, we continue today on the defensive side of the ball with strike outs.
As always, the White Sox and Cubs are the leaders in this category based on the raw numbers, as they are the teams I’ve seen in action most often. When you adjust the numbers per game, both teams still fare well, placing fourth and third respectively. The California version of the Angels lead the way. with an even nine strike outs per game. The Miami iteration of the Marlins and the Devil Rays bring up the rear with an even five strike outs per game.
Strike Outs
| Team Name | Strike Outs |
|---|---|
| Chicago White Sox | 5387 |
| Chicago Cubs | 3558 |
| Kansas City Royals | 463 |
| Minnesota Twins | 457 |
| Cleveland Indians | 440 |
| Detroit Tigers | 407 |
| Houston Astros | 350 |
| Milwaukee Brewers | 320 |
| Pittsburgh Pirates | 295 |
| Seattle Mariners | 271 |
| Los Angeles Angels | 254 |
| Cincinnati Reds | 251 |
| Texas Rangers | 247 |
| New York Yankees | 240 |
| Boston Red Sox Continue reading → |
The Cubs Get Their Man
 After being linked to nearly all four of the star free agent shortstops this winter, the Cubs nabbed the last one on the table, getting Dansby Swanson on a seven-year, $177 million deal. The deal is expected to include a full no-trade clause. Since the Braves had given Swanson a qualifying offer, the Cubs will lose their second-round draft pick and $500,000 in international free agent allocation.
Swanson, who will turn 29 prior to the start of the 2023 season, put together the best offensive season of his career last year. He will push Nico Hoerner to second base, giving the Cubs a solid defense in the middle of the infield. It also leaves Nick Madrigal, acquired from the White Sox in 2021, on the outside looking in.
The White Sox Get Their Man
 The hot stove warmed up a bit this past Friday as word broke that the White Sox had signed former Red Sox/Royal/Yankee outfielder Andrew Benintendi to a five-year, $75 million contract. Slotting into left field, Benintendi strengthens the outfield defense, where the White Sox have been playing first basemen out of position for most of the past two seasons, and adds a much needed lefty bat to the lineup.
The addition of Benintendi likely spells the end of Eloy Jimenez as an everyday outfielder and pushes the slugger into the DH role he was destined to inhabit. He should also add some balance to a lineup that has struggled against right handed pitching over much of the past two seasons.
Benintendi has been a long target of the White Sox. They were linked to him in the 2015 draft, where the Red Sox selected him one pick before the White Sox selected Carson Fulmer. He was also rumored to be a target in the Chris Sale trade, which eventually netted fellow Red Sox prospect Yoan Moncada. Not to mention that Benintendi spent the most of the past two seasons with the Royals, alongside new White Sox manager Pedro Grifol and coaches Mike Tosar and Eddie Rodríguez.
Benintendi’s $75 million contract now becomes the largest deal in franchise history, surpassing Yasmani Grandal’s $73 million deal inked prior to the 2020 season. At this rate, the White Sox will crack the nine-figure contract mark in 2048.