Team Stats: Stolen Bases

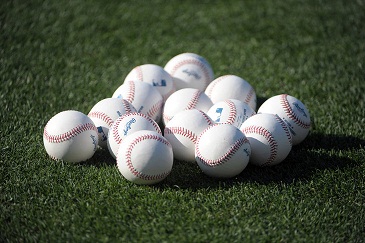
With one game of the 2022 World Series in the books, we still have about five months now until baseball returns to Chicago.  I thought it would be a good time to revisit, for the first time in six years, the all-time rankings in both offensive and defensive categories for all iterations of the current 30 teams for the 1040 games I’ve identified that I have attended.  We continue today back on the offensive side of the ball with stolen bases.

Based on the raw numbers, the White Sox and Cubs continue to be the far and away leaders in this category, as they are the two teams I’ve seen the most by a wide margin.  When you adjust the numbers per game, the Devil Rays and the California and Anaheim versions of the Angels jump to the top of the heap.  The White Sox fall to the bottom of the middle third and the Cubs are squarely towards the low end, with just under one stolen base every other game.  The Braves are the worst team that I have seen somewhat often, with less than 0.3 stolen per game, while the Miami incarnation of the Marlins have yet to steal a base in a game I have attended.

Stolen Bases

Team Name SB
Chicago White Sox 388
Chicago Cubs 215
Kansas City Royals 50
Cleveland Indians 44
Detroit Tigers 41
Milwaukee Brewers 40
Houston Astros 38
Cincinnati Reds 32
Texas Rangers 32
Minnesota Twins Continue reading →

Book 46 (of 52) – Daphne

Daphne – Josh Malerman

The town of Samhattan has a secret, one that hides in the back recesses of townspeople’s brains.  When that secret comes out, the members of the local high school’s girls’ basketball team start paying the price.  While the detective assigned to the case, not locally born and raised, tries to get to the bottom of both the secret before there is no one left from the team, the remaining girls try to come to grips with what is after them and how they alone can stop it.

Just in time for Halloween, Daphne was recommended to me by some article as a recent horror entry that was a worthy read this time of year.  Unfortunately, I don’t quite agree.  Apparently, author Josh Malerman originally wrote this as a novella and was convinced to build it out to novel length.  That, I think, did some harm, as the tale did feel repetitive in parts.  On the other hand, they mystery of who was responsible for the killings was kind of ambiguous, bouncing back and forth between a human perpetrator and the supernatural being known as Daphne.  Anyway, this was my first, and probably going to end up being my only, exposure to Malerman’s work.

FB8 – Week 39

After two down weeks, I managed to put together a fairly consistent week that put me back up above 30,000 steps.  Things got off to a good start on Sunday, as I finished with 6100 steps after a trip to the grocery store and to find some new pants.  Monday fell off a bit but was still a (what passes as) respectable 4700 steps.  Tuesday was just a little lower, dropping down to 4300 steps.  Wednesday jumped back up a bit, finishing with 4900 steps.  Things started to drop again on Thursday, going down to 4600 steps.  Friday was the low point of the week and still managed to end 30 steps shy of 4100.  A trip out to see some Stranger Things Halloween decorations on Saturday helped push me over 4400 steps.

Total steps: 33,233

Daily average: 4747.6

Travelling The 50 States – Indiana

Over my 47 years, I’ve done my fair share of travelling across these United States.  I thought it would be an interesting experiment go look back at those trips to each of the 31 states I have visited (62% isn’t bad, is it?) and see if, and when, I may be returning.  Working in alphabetical order, we start today with the 19th state to be added to the Union: Indiana.

State: Indiana
Joined the Union: 1816
Visits: 1100+

From the fall of 1992 through the spring of 1997, I matriculated at Purdue University in West Lafayette, Indiana.  Accounting for breaks, weekends home, and other holidays, I estimate I would have spent over 1100 days in the Hoosier State.

While it is possible that I visited the state of Indiana at some time during my youth, given its proximity to the Chicagoland area, the first confirmed visit would have been in the early 90s, when I made my campus visit to Purdue.  I can’t say that i have any particular memories from this trip, but I’m fairly sure it happened.  Starting in August of 1992, West Lafayette became my home away from home for the next five years.  In December of 1993, I made my first visit to Indianapolis for a double header of Purdue women’s and men’s basketball at Market Square Arena.

As I was stopped at a gas station before getting on I-65 on my way home after graduation, I said that I would never return to the state of Indiana again.  That pledge lasted a little more than two years, as I returned to campus in September of 1999 to see Purdue defeat Notre Dame at Ross-Ade Stadium.  I would return again in December of 2000 for the final game of the season, seeing Purdue defeat IU and earn their first trip to the Rose Bowl since 1967.

My next trip to Indiana came in March of 2001, when I saw the Monkees at the Star Plaza Theatre in Merrillville.  In November of 2004, I returned once again to my old stomping grounds to see Purdue once again defeat Indiana at Ross-Ade Stadium.  I made two football trips the following year, watching Purdue fall to Notre Dame in October and defeating Illinois in November.  In 2006, I made my first visit to South Bend with friends from work to see Notre Dame once again defeat the Boilermakers at Notre Dame Stadium.

My next trip to Indiana came in November of 2008, when Purdue managed to defeat Michigan at Ross-Ade Stadium.  The following September, it was another loss against Notre Dame.  In October of 2011, there was another family clash as Purdue defeated Illinois by a touchdown.  Two months later, I spent New Year’s Eve of 2011 at Mackey Arena, watching Purdue defeat the Fighting Illini in my first basketball game back on campus since graduating in 1997.  I returned a little more than a year later on the second day of 2013 for another successful tilt against the Illini at Mackey Arena.

In 2013, I made the mistake of returning to Ross-Ade stadium in September with a work friend, as her husband’s alma mater, Northern Illinois, throttled Purdue.  In March of 2015, a trip to Mackey Arena saw the basketball team beat the Illini, but the football tilt that November went the other way. Continue reading →

Team Stats: Home Runs Surrendered

With the postseason now in full swing, it will be a long six months until baseball returns to Chicago.  I thought it would be a good time to revisit, for the first time in six years, the all-time rankings in both offensive and defensive categories for all iterations of the current 30 teams for the 1040 games I’ve identified that I have attended.  We continue today with our first look at the defensive side of the ball with home runs surrendered.

Based on the raw numbers, the White Sox and Cubs are far and away the leaders in this category, which is to be expected as they are the teams I’ve seen most often.  When you adjust the numbers per game, the Expos jump to the top (or bottom, depending on your point of view) of the heap, with an even two home runs given up per game.  The Rockies, Phillies, Nationals, Diamondbacks, the Miami version of the Marlins, and Devil Rays are the only teams below one home run per game.  The remaining teams fall in between.

Home Runs Surrendered

Team Name Home Runs Surrendered
Chicago White Sox 800
Chicago Cubs 476
Minnesota Twins 98
Kansas City Royals 70
Cleveland Indians 61
Detroit Tigers 59
Houston Astros 57
Pittsburgh Pirates 54
Milwaukee Brewers 53
Seattle Mariners 53
Cincinnati Reds 51
Baltimore Orioles 47
St. Louis Cardinals 44
Texas Rangers 44
Los Angeles Angels Continue reading →

FB8 – Week 38

Yet another disappointing week where I’m still stuck below 30,000 steps.  The week actually got off to a pretty decent start on Sunday, where I finished 23 steps away from 4400.  A walk around the block on Monday helped turn it into the best day of the week, ending with 4900 steps.  The week then fell off a cliff on Tuesday, as I dropped all the way down to 2300 steps.  Wednesday saw a slight increase, falling 15 steps shy of 2800.  Things improved again on Thursday, as I managed to go up to 3400 steps.  Friday dropped just a tad, finishing with only 3300 steps.  Saturday saw a nice improvement, going up to 4000 steps.

Total steps: 25.210

Daily average: 3601.4

Book 45 (of 52) – Normal People

Normal People – Sally Rooney

Normal People, the second novel from Sally Rooney, follows the relationship of two Irish teens, starting in their local school through their time at Trinity College in Dublin.  Their on-again, off-again romantic relationship, which neither one is quite willing to admit to, lasts for years, despite their different social statuses, which reverse as they reach college.

I was only really aware of this book due to an adaptation on Hulu, which I have yet to watch.  These two are very damaged characters, one of whom has reason to be and the other, well, not so much.  It was interesting seeing their relationship shift and grow over time, and, at the end of the day, it was a satisfying read, but I don’t think I’m going to be running out to see what else Rooney has to offer.

Travelling The 50 States – Illinois

Over my 47 years, I’ve done my fair share of travelling across these United States.  I thought it would be an interesting experiment go look back at those trips to each of the 31 states I have visited (62% isn’t bad, is it?) and see if, and when, I may be returning.  Working in alphabetical order, we continue today with the 21st state to be added to the Union: Illinois.

State: Illinois
Joined the Union: 1818
Visits: 16,000+

How do you track how often you’ve been in the state you’ve lived in your entire life, save for your time away at college?  My first “visit” came nearly 48 years ago on the day I was born at Mercy Hospital on the south side of Chicago.

I’ve managed to do 18 of the Bicentennial Bucket List: 200 Things To Do In Illinois, published by the Chicago Tribune in 2018 to celebrate the best the state has to offer in history, food, architecture, culture, sports, nature, drink, and oddities.  Among the places I visited were Water Tower, Morton Arboretum, Route 66, United Center, Skydeck at Willis Tower, the former Arlington International Racecourse, Rialto Square Theatre, Lake Michigan, The Second City, Chicago Sports Museum, and the Superman statue in downstate Metropolis.

I’ve seen baseball games at Wrigley Field, Comiskey Park, and Guaranteed Rate Field.  I’ve seen football games at Soldier Field, Memorial Stadium, Ryan Field, and Wrigley Field.  I’ve seen basketball games at the United Center, Welsh-Ryan Arena, State Farm Center, and Allstate Arena.  I’ve seen hockey games at the United Center.  I’ve seen both the White Sox and the Cubs win the World Series.  I’ve seen the Bears win a Super Bowl.  I’ve seen the Bulls win 6 NBA Championships.  I’ve even seen the Blackhawks win a Stanley Cup or two.

I’ve seen concerts at Wrigley Field, City Winery, Ravinia, the Riviera Theatre, Abbey Pub, Metro, the Chicago Theatre, United Center, Charter One Pavilion, Allstate Arena, The Vic Theatre, House of Blues, World Music Theatre, Soldier Field, and Mabel’s,

Team Stats: Batting Average

While the postseason is just getting underway, it will be six months until baseball returns to Chicago.  I thought it would be a good time to revisit, for the first time in six years, the all-time rankings in both offensive and defensive categories for all iterations of the current 30 teams for the 1040 games I’ve identified that I have attended.  We start today on the offensive side of the ball with team batting average.

The newly christened Cleveland Guardians take over the top spot and join the California Angels, who I only saw live and in person twice, are the only teams to post an average over .300.  The Washington Nationals, who, sadly, have now had thirteen games to make a mark, are still the only team to post an average under .200.  In between, there is a slight correlation between the teams’ batting average and their record in these games, though with some surprising anomalies.

Batting Average

Team Name BA
Cleveland Guardians 0.304
California Angels 0.304
Anaheim Angels 0.292
Arizona Diamondbacks 0.278
Tampa Bay Devil Rays 0.272
Cleveland Indians 0.263
Chicago Cubs 0.261
Florida Marlins 0.260
Milwaukee Brewers 0.259
Chicago White Sox 0.258
Boston Red Sox 0.257
Kansas City Royals 0.257
Oakland Athletics Continue reading →