Games Per Stadium By Year

With the 2023 season officially in the rearview mirror, let’s take a look at the number of games I’ve attended each year at one of the now-29 different stadiums I’ve visited over the years.

Games Per Stadium Per Year

GameYear StadiumName TotalGames
2008 US Cellular Field 46
2003 Wrigley Field 46
Surprise playoff runs for the White Sox in 2008 and the Cubs in 2003 led to what remains my highest single season totals ever, boosted by post-season play.
2021 Guaranteed Rate Field 44
My highest-post-pandemic total, helped in part by a division champion and the desire to get back to the ballpark following the lockdown of 2020.
2007 Wrigley Field 43
2004 Wrigley Field 41
My highest non-playoff total saw me attending over half of the home games for the Cubs in 2004.
2011 US Cellular Field 40
2009 US Cellular Field 40
2010 US Cellular Field 36
2005 Wrigley Field 34
2008 Wrigley Field 34
2017 Guaranteed Rate Field 33
2016 US Cellular Field 32
2006 US Cellular Field 32
2023 Guaranteed Rate Field 32
2015 US Cellular Field 31
2012 US Cellular Field 31
2007 US Cellular Field 29
2014 US Cellular Field 28 Continue reading →

Travelling The 50 States – California

Over my 47 years, I’ve done my fair share of travelling across these United States.  I thought it would be an interesting experiment go look back at those trips to each of the 31 states I have visited (62% isn’t bad, is it?) and see if, and when, I may be returning.  Working in alphabetical order, we start today with the 31st state to be added to the Union: California.

State: California
Joined the Union: 1850
Visits: 11

With eleven visits between 1998 and 2019, the Golden State is the state I have visited the most, outside of those I have lived in and/or attended college.

My first visit was in 1998 to attend Comic Con International in San Diego.  I went early, spending the entire week and enjoying some pre-Con time checking out the sights, including the San Diego Zoo.

I returned the following year for Labor Day weekend, but this time up to the San Francisco Bay area, to visit my old friend Scott, who had moved out there after graduating to work at AMD.  What I remember from that trip is my first Giants/Phillies tilt at the former Candlestick Park, my first trip to the toilet that at the time was called Network Associates Coliseum, and a car trip over the Golden Gate Bridge.

I returned to San Diego for Comic Con in 2000 and 2003.  I don’t remember much of the 2000 trip, but the 2003 trip included my one visit to the former Jack Murphy Stadium to see the Padres face the Diamondbacks.  At the Con, I managed to see many of the stars (or, at least, bit players) from Buffy The Vampire Slayer, Smallville, and Tru Calling.

With the Cubs coming off their first division title since 1989 and a new stadium opening in San Diego, my friend Pete and I planned a trip for the Cubs mid-May road trip.  We attended all three games at PETCO Park, which the Cubs swept, while also taking in the local sights and the ambience of the Elephant and Castle bar in our hotel. Continue reading →

By The Numbers – 21

In 1929, uniform numbers appeared on the back of baseball jerseys for the first time, thanks to the Indians and the Yankees.  By 1937, numbers finally appeared across all uniforms, both home and away, across both major leagues.  Since that time, 81 distinct numbers have been worn by members of the White Sox, while the Cubs boast 76.

Today, we continue our look at those players, picking our favorite, if not the best, player to wear each uniform number for both Chicago teams with #21.  69 different players have donned #21 while playing in Chicago, 26 for the White Sox and 43 for the Cubs.

Near the end of the spring training in 1992, Sammy Sosa, along with Ken Patterson, was acquired from the White Sox for a fading George Bell.  Wearing #21, Sosa blossomed with the Cubs, going from 8 home runs and 25 RBIs in his first season to 33 home runs and 93 RBIs in his second, becoming the first 30-30 player in Cubs history.  Sosa continued to hit for power and speed in 1994, but he also upped his batting average to .300 for the first time.  Sosa was named to his first All-Star team in 1995, on his way to 36 home runs and 119 RBIs.  In 1996, Sosa continued his success, hitting .273 with 40 home runs and 100 RBIs.  1997, however, saw a decline in Sosa, who batted just .251 and posted a paltry .300 on-base percentage while leading the league with 174 strikeouts, despite hitting 36 home runs and driving in 119 runs.

A bulked-up Sammy Sosa arrived in camp in 1998, looking to turn things around, and turn them around he did.  While the surprising Cubs were in contention for the first time in nearly a decade, Sosa put on a home run barrage of historic proportions.  In the month of June, Sosa launched 20 home runs, drove in 47, and slugged .842 while pulling himself into the home run chase with Mark McGwire.  Sosa hit his 62nd home run on September 13, passing Roger Maris, and finished the season with 66, 4 behind McGwire’s then-record 70.  Sosa replicated that performance in 1999, hitting 63 home runs, again trailing McGwire, who hit 65.  Sosa finally led the league in home runs in 2000, though with “only” 50.  He managed another season for the ages in 2001, as he hit 64 home runs, becoming the first player to hit 60 or more home runs three times, and setting career highs in runs scored, RBIs, walks, OBP, slugging percentage, and batting average.  He notched his second career home run crown in 2002, adding 49 to his ledger.

Things started to turn for Sosa in 2003, despite the Cubs driving towards their first division title since 1989.  He went on the disabled list for the first time since 1996 in May and, when he returned, he was ejected, and ultimately suspended, for using a corked bat in the June 3 game against the Devil Rays.  He finished the season with 40 home runs, his lowest total since 1997, as the Cubs famously blew a 3-1 lead in the NLCS despite being 5 outs away from the pennant in Game 6.  The following May, he landed on the disabled list again following a violent sneeze at PETCO Park.  After returning from the DL, Sosa struck out 98 times the rest of the way, while hitting .238 and posting an OPS of .749.  For the entire year, Sosa hit .253, his worst average since 1997, with only 35 home runs and 80 RBIs, his lowest total since 1994.  When the Cubs fell out of contention for the NL Central title after losing 7 of their final 9 games, Sosa was given the day off for the final game of the season.  Unfortunately, he was spotted leaving Wrigley Field before the game even started while his teammates took out their frustrations with their “leader” my smashing his boombox with their bats.  That January, with the declined performance and the growing suspicion of PED use on their minds along with the end of the 2004 season, the Cubs decided to move on, trading Sosa to the Orioles for Jerry Hairston Jr. and Mike Fontenot.

On the South Side, Todd Frazier wore #21 after being acquired from the Reds in a three-team deal prior to the 2016 season.  On July 11, Frazier placed second in the Home Run Derby, losing to Giancarlo Stanton in the final round.  Frazier finished the year with career highs in home runs, runs batted in and walks despite hitting a career low .225 batting average in 158 games.  With the White Sox throwing in the towel and entering a full-fledged rebuild in 2017, Frazier was traded to the Yankees at the deadline.
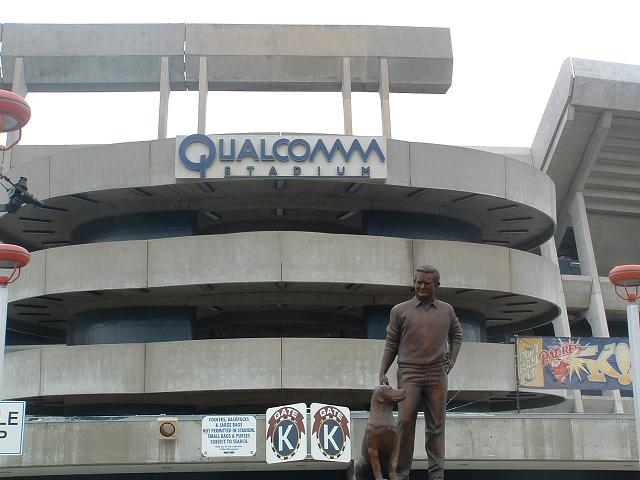
Games Per Stadium – All Time

It’s been 4 years (to the day!) since we’ve taken a look at the now 27 different stadiums I’ve been to and how often I’ve been to them.  With the World Series over and the off season upon us, it’s time to update that list.  I’ve added 5 additional stadiums in this time, three in 2019 and two this year.  As usual, different names for the same physical stadium are counted separately.

Games Per Stadium
Stadium Name Total Games
US Cellular Field 414
Wrigley Field 370
Guaranteed Rate Field 122
Comiskey Park II 38
Comiskey Park 13
Great American Ballpark 7
Miller Park 7
Ameriquest Field 4
PETCO Park 3
Ballpark in Arlington, The 3
Progressive Field 2
Target Field 2
Tropicana Field 2
Comerica Park 2
Cinergy Field Continue reading →

Padres All Time Leaders – Through 2019

With baseball shut down because of the corona virus, I thought it would be an interesting time to look back at the all time leaders in both offensive and defensive categories for all 30 teams. We continue today with the San Diego Padres.

The Padres began life in 1969, joining the National League along with the Montreal Expos.  I’ve seen them play 19 times at 5 different ballparks, first in 1985 at Wrigley Field and, most recently, in 2017.  I was supposed to take in the 3 game series between them and the White Sox next month at PETCO Park.

Home Runs

Name Total
Adrian Gonzalez 2
Ramon Hernandez 2
Mike Cameron 2
Khalil Greene 2

Hits

Name Total
Ryan Klesko 9
Sean Burroughs 9
Brian Giles 8

Runs

Name Total
Adrian Gonzalez 7
Mark Loretta 5
Ramon Hernandez 4
Mike Cameron 4

RBI

Name Total
Khalil Greene 8
Ramon Hernandez 6
Ryan Klesko 6

Doubles

Name Total
Ryan Klesko 3
Adrian Gonzalez 3
Will Venable 3

Triples Continue reading →

Ballpark Tour: Padres

Spring training is right around the corner as we continue our tour of all of the baseball stadiums I’ve been to over the years. Today we travel to southern California for the baseball homes of the San Diego Padres. Between the two stadiums that have been located in the paradise that is San Diego, I’ve seen 4 games. So, without further ado, let’s take a deeper look at my history with Qualcomm Stadium and PETCO Park.

Stadium Name: Jack Murphy Stadium/Qualcomm Stadium

Years in Service: 1969 – 2003

Visits: 1

San Diego Stadium opened on August 20, 1967 as the home of the AFL’s Chargers and opened for baseball the following spring for the final season of the minor league San Diego Padres.  The following season, San Diego’s expansion team, also named the Padres, moved in and stayed as the main tenants until the end of the 2003 season.  The stadium was renamed in 1980 for local sportswriter Jack Murphy, who had championed support for the building of the stadium, after he passed away.  That name stuck until 1997, when the naming rights were sold to technology company Qualcomm.

In 2003, I was in San Diego for what, to date, was my 3rd and final Comic Con.  On the afternoon of July 17, I skipped out on the con and took the trolley out to Mission Valley to take in the day’s contest between the Padres and the Diamondbacks.  I don’t remember much about the game, which the Diamondbacks won handidly 9-1, other than Curt Schilling taking the bump for the Dbacks.  The park, one of the last remaining cookie cutter stadiums that popped up in the late 60s and early 70s and designed to house both baseball and football teams while doing service to neither, did not really register one way or the other and hold’s no particular space in my memory.  I do seem to remember a giant outdoor escalator, but that might have been Candlestick.

Stadium Name: PETCO Park

Years in Service: 2004 – Present

Visits: 3

After 35 seasons at the Murph, the Padres moved downtown in 2004 with the opening of PETCO Park.  The new stadium was initially supposed to open for the 2002 season, but legal battles and political tomfoolery delayed the project for two years.  The first event held at PETCO Park was an NCAA invitational tournament hosted by San Diego State University, whose head coach was former Padres great Tony Gwynn.  The Padres themselves christened the stadium on April 8 with a 10 inning victory over the Giants.

With the Cubs, coming off their surprising run towards the NL title in 2003, scheduled for a weekend series at the newly opened PETCO Park in the middle of May in 2004, a trip out to the coast was in order.  The Cubs swept the three game series against the Padres, and a tremendous weekend was had.  The new park was a vast improvement over the old Jack Murphy.  One of these days, I’ll need to take a return trip.

Games Per Stadium By Year

With the 2019 season in the rear view mirror, let’s take a look at the number of games I’ve attended per year at one of the 25 different stadiums I’ve visited over the years.


Year Stadium Name Total Games
2008 US Cellular Field 46
2003 Wrigley Field 46
Surprise playoff runs for the White Sox in 2008 and the Cubs in 2003 led to my highest single season totals ever, boosted by post-season play.
2007 Wrigley Field 43
2004 Wrigley Field 41
My highest non-playoff total saw me attending over half of the home games for the Cubs in 2004.
2011 US Cellular Field 40
2009 US Cellular Field 40
2010 US Cellular Field 36
2005 Wrigley Field 34
2008 Wrigley Field 34
2017 Guaranteed Rate Field 33
2006 US Cellular Field 32
Post World Series championship started an attendance jump.
2016 US Cellular Field 32
2012 US Cellular Field 31
2015 US Cellular Field 31
2007 US Cellular Field 29
2014 US Cellular Field 28
Continue reading →

Games Per Stadium – All Time

It’s been 3 years since we’ve taken a look at the now 22 different stadiums I’ve been to and how often I’ve been to them.  With the World Series over and the off season upon us, it’s time to update that list.  Again, I’ve only added 2 additional stadiums in this time, one in 2015 and the other this year.  Different names for the same physical stadium are counted separately.

Games Per Stadium
Stadium Name Total Games
US Cellular Field 414
Wrigley Field 344
Comiskey Park II 38
Guaranteed Rate Field 33
Comiskey Park 12
Great American Ballpark 7
Miller Park 6
Ameriquest Field 4
PETCO Park 3
Ballpark in Arlington, The 3
Target Field 2
Comerica Park 2
AT&T Park Continue reading →

Games Per Stadium – All Time

20109565It’s been more than 3 years since we’ve taken a (single) look at the 18 different stadiums I’ve been to and how often I’ve been to them.  Sadly, I’ve only added 2 additional stadiums in this time, both of which were this year.  Once again, different names for the same stadium are counted separately.

Stadium Name Total Games
US Cellular Field 351
Wrigley Field 317
Comiskey Park II 38
Comiskey Park 12
Great American Ballpark 7
Ameriquest Field 4
Miller Park 4
Ballpark in Arlington, The 3
PETCO Park 3
Target Field 2
Continue reading →

Games Per Stadium By Year

With the 2014 season in the rear view mirror, let’s take a look at the number of games I’ve attended per year at a particular stadium.

Games Per Stadium Per Year

GameYear StadiumName TotalGames
2008 US Cellular Field 46
2003 Wrigley Field 46
Surprise playoff runs for the White Sox in 2008 and the Cubs in 2003 led to my highest single season totals ever, boosted by post-season play.
2007 Wrigley Field 43
2004 Wrigley Field 41
My highest non-playoff total saw me attending over half of the home games for the Cubs in 2004.
2011 US Cellular Field 40
2009 US Cellular Field 40
2010 US Cellular Field 36
2005 Wrigley Field 34
2008 Wrigley Field 34
2006 US Cellular Field 32
Post World Series championship started an attendance jump.
2012 US Cellular Field 31
2007 US Cellular Field 29
2014 US Cellular Field 29
Continue reading →