#25 – Wilson Alvarez

Name: Wilson Alvarez

Rank: 25

Position: P

Years With White Sox: 1991-1997

Five days after making his major league debut for the Rangers, Wilson Alvarez was acquired by the White Sox, along with Scott Fletcher and Sammy Sosa, for Harold Baines and Fred Manrique on July 29, 1989.  After spending the next 2 calendar years in the minor leagues, Alvarez returned to the big leagues and made his White Sox debut on August 11, 1991, throwing an unlikely no hitter against the Orioles at Memorial Stadium.  With nowhere to go but down from there, he made 8 additional starts for the White Sox down the stretch, finishing the year with a 3-2 record and a respectable 3.51 ERA.

After tossing nearly 300 innings the previous year between winter league, Triple A, and the big leagues, 1992 saw Alvarez work mostly out of the bullpen, getting only 9 starts out of his 34 appearances.  He posted a career high 1.674 WHIP, giving up 65 walks in just over 100 innings.  This led to an unfortunate 5.20 ERA, despite a 5-3 record.

In 1993, Alvarez managed to break in to the rotation full time.  Despite leading the league with 122 walks, he finished second in the AL with an ERA of 2.95 and ended up with a 15-8 record as the White Sox won the AL West title for the first time in a decade.  He was the winning pitcher in Game 3 of the ALCS, holding the Blue Jays to a single run while throwing a complete game.

Alvarez improved in 1994, earning his first (and only) All Star nod and cutting his walk total nearly in half.  Part of that, of course, was due to the player strike that ended the season in August, and he finished the year with a 12-8 record and a 3.45 ERA.  When baseball returned in 1995, Alvarez struggled to regain his groove, finishing with a losing record for the first time and an ERA of 4.32.

1996 saw a nice bounce back for Alvarez.  While his ERA was still an elevated 4.22, he tied his career high with 15 wins and set career highs for innings pitched and strikeouts.  He continued to impress in 1997, putting up a 9-8 record with a 3.03 ERA by the end of July, when, with the White Sox a mere 3 games back in the standings, he, along with Danny Darwin and Roberto Hernandez, was sent to the Giants for Brian Manning, Lorenzo Barceló, Mike Caruso, Keith Foulke, Bob Howry, and Ken Vining in what would become known as the White Flag Trade.

Alvarez’s numbers in a White Sox uniform, both for games I attended and overall, were:

Continue reading →

#33 – Ron Kittle

Name: Ron Kittle

Rank: 33

Position: LF/DH

Years With White Sox: 1982-1986, 1989-1990, 1991

Ron Kittle joined the White Sox organization in Septmber of 1978.  He worked his way through the minor leagues before making his major league debut on September 2, 1982, pinch hitting for Aurelio Rodriguez and striking out in the White Sox 6-5 victory over the Rangers at Comiskey Park.  Kittle got sporadic playing time over the final month of the season, earning just 29 at bats in 20 games.  He hit .241 with a single home run.

Kittle, and the White Sox, broke out in a big way in 1983.  While the team charged towards their first division title, Kittle earned an All Star nod and finished the year with a team rookie record of 35 home runs while hitting .254 and driving in 100.  Kittle was knocked out of the ALCS against the Orioles after getting hit by a pitch in Game 3, finishing the series with just 2 hits in 7 at bats.  His season earned him Rookie of the Year honors.

1984 was a bit of a letdown for both Kittle and the White Sox.  While the team failed to perform up to the expectations set the previous year, Kittle did the same, falling to a .215 average.  His power numbers remained, as he clubbed 32 home runs, but his OPS was down by 70 points.  There was a slight improvement in 1985, with his average improving to .230, but he hit only 26 home runs and drove in just 58 runs in 116 games.

In 1986, Kittle was hitting .213 with 17 home runs at the trade deadline when he, along with Joel Skinner and Wayne Tolleson, were sent to the Yankees for Ron Hassey, Carlos Martinez, and a player to be named later.  He rejoined the White Sox a year and a half later, signing as a free agent after the 1988 season.

Injuries limited Kittle to just 51 games in 1989.  In 169 at bats, he hit .302 with 11 home runs and 37 RBI.  He returned in 1990, seeing his average drop to .245 with 16 home runs in 83 games when, again at the trade deadline, he was sent to the Orioles in exchange for Phil Bradley.

Kittle returned for one final hurrah with the White Sox in 1991, signing as a free agent on June 19 before being released on August 15.  In between, he appeared in 17 games and hit only .191 with 2 home runs.

Kittle’s numbers in a White Sox uniform, both for games I attended and overall, were:

Continue reading →

#34 – John Danks

Name: John Danks

Rank: 34

Position: P

Years With White Sox: 2007-2016

John Danks was acquired by the White Sox, along with Nick Masset, from the Rangers for Brandon McCarthy following the 2006 season.  He broke camp with the Sox in 2007 and made his major league debut on April 8, picking up the loss against the Twins at US Cellular Field.  Danks, along with the rest of the White Sox, struggled through 2007, finishing the year with a 6-13 record and a 5.50 ERA.

2008 was a different story for both the White Sox and Danks.  Posting a career-best 3.32 ERA, Danks finished the year at 12-9 and had quite possibly the best outing of his career in game 163, throwing 8 scoreless innings of 2 hit ball against the Twins to secure the Central Division title.  Less than a week later, he picked up the lone White Sox victory in the ALDS against the Rays.

Danks had continued success in both 2009 and 2010, combining for a 28-22 record over the two years, with an ERA in the 3.70s both years.  2011 went south for both the White Sox and John Danks, as his ERA jumped to 4.33 while manager Ozzie Guillen lost control of the team before leaving in the final week to head to the Marlins.  Following the season, the White Sox signaled their faith in Danks, signing him to a 5 year extension worth $65 million.

Danks struggled through 9 starts in 2012 before hitting the disabled list with a mysterious shoulder injury.  When he finally underwent surgery, doctors found a torn shoulder capsule.  Very few pitchers have undergone this surgery, and even fewer have successfully returned to the same level they were before the injury.

Sadly, Danks’ recovery did not happen as anyone would have wanted, though not for a lack of effort.  He returned in 2013, making 22 starts and going 4-14 with a 4.75 ERA.  2014 was more of the same, as his ERA was 4.74, though his record improved to 11-11.  And 2015, again, saw Danks put up an ERA of 4.71 in 30 starts.

In 2016, Danks, in the final season of his contract and due $14.25 million, went 0-4 with a 7.25 ERA in April.  With the surprising White Sox in first place after 1 month and with Danks accounting for half of the team’s losses, being an innings eater was no longer good enough.  He was designated for assignment on May 3, ending his White Sox career.

Danks’ numbers in a White Sox uniform, both for games I attended and overall, were:

Continue reading →

All Time Team Records

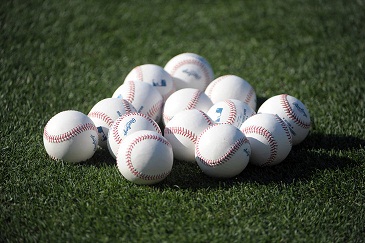
baseballs3Yet another exciting baseball season is upon us, and it is time once again to look at the all-time team records for games that I have attended dating back to 1984.  The Cubs begin the season as defending champions for the first time since 1909 while the White Sox finally start their long-overdue rebuilding effort, so both sides of town are pointing in different directions.  Either way, the 2017 season should be an exciting one.

All-Time Team Records
Team Name Won Loss Winning Pctg
California Angels 1 0 1.000
Arizona Diamondbacks 13 2 0.867
Florida Marlins 15 8 0.652
Philadelphia Phillies 10 6 0.625
Toronto Blue Jays 13 9 0.591
New York Yankees 12 9 0.571
Los Angeles Angels 16 13 0.552
Boston Red Sox 14 12 0.538
Colorado Rockies 7 6 0.538
Chicago Cubs 203 179 0.531
Chicago White Sox 267 237 0.530
Cleveland Indians 23 21 0.523
Kansas City Royals Continue reading →

Team Stats: Home Run

With 1 week until baseball in Chicago returns, I thought it would be interesting to look at the all time rankings in both offensive and defensive categories for all iterations of the current 30 teams for the 833 games I’ve identified that I have attended. We finish up today on the offensive side of the ball with home runs.

As you might expect by this point, the White Sox and Cubs, based on the raw numbers, are far and away the leaders in this category, as they are the teams I’ve seen the most.  When you adjust the numbers per game, the California incarnation of the Angels and the Diamondbacks are the only teams at or above 2 home runs per game.  The Nationals and the Anaheim version of the Angels are the only teams with less than a home run every other game.

Home Runs
Team Name Home Runs
Chicago White Sox 605
Chicago Cubs 437
Cleveland Indians 53
Kansas City Royals 48
Detroit Tigers 45
Minnesota Twins 44
Houston Astros 40
Texas Rangers 40
Milwaukee Brewers 39
Seattle Mariners Continue reading →

Team Stats: Earned Run Average

With 2 weeks until baseball in Chicago returns, I thought it would be interesting to look at the all time rankings in both offensive and defensive categories for all iterations of the current 30 teams for the 833 games I’ve identified that I have attended. We continue today on the defensive side of the ball with earned run average.

Both the White Sox and Cubs are in the top half for team ERA, at 4.10 and 3.97 respectively.  The Anaheim iteration of the Angels lead the way at just under 2.60.  Their earlier counterparts from California are on the opposite end of the spectrum, clocking in at an even 6.00.

Earned Run Average
Team Name ERA
Anaheim Angels 2.59620377314948
Arizona Diamondbacks 2.77443609022556
San Francisco Giants 2.91412259138847
Montreal Expos 3.4000755572346
Los Angeles Angels 3.58378597800244
Philadelphia Phillies 3.69343107010444
Washington Nationals 3.74644733442425
Boston Red Sox 3.87378352436825
Miami Marlins 3.9375
Oakland Athletics Continue reading →

Team Stats: Runs Batted In

With 3 weeks until baseball in Chicago returns, I thought it would be interesting to look at the all time rankings in both offensive and defensive categories for all iterations of the current 30 teams for the 833 games I’ve identified that I have attended. We continue today on the offensive side of the ball with runs batted in.

Based on the raw numbers, the White Sox and Cubs are far and away the leaders in this category, as they are the teams I’ve seen the most.  When you adjust the numbers per game, the California iteration of the Angels and the Devil Rays lead the way as the only teams over 6.  The Nationals and the Miami incarnation of the Marlins are the only teams that failed to average 3 runs batted in per game.

Runs Batted In
Team Name RBIs
Chicago White Sox 2209
Chicago Cubs 1677
Cleveland Indians 227
Minnesota Twins 184
Detroit Tigers 182
Kansas City Royals 178
Houston Astros 175
Milwaukee Brewers 170
Cincinnati Reds 168
Pittsburgh Pirates Continue reading →

Team Stats: Strike Outs

With 1 month until baseball in Chicago returns, I thought it would be interesting to look at the all time rankings in both offensive and defensive categories for all iterations of the current 30 teams for the 833 games I’ve identified that I have attended. We continue today on the defensive side of the ball with strike outs.

Based on the raw numbers, the White Sox and Cubs are far and away the leaders in this category, as they are the teams I’ve seen the most.  When you adjust the numbers per game, both teams, along with the Brewers, fare the best as well.  The Cubs lead the way with just over 8 strike outs per game.  The California version of the Angels, the Miami iteration of the Marlins, and the Devil Rays bring up the rear with an even 5 strike outs per game.

Strike Outs
Team Name Strike Outs
Chicago White Sox 3851
Chicago Cubs 3075
Kansas City Royals 339
Minnesota Twins 330
Cleveland Indians 292
Milwaukee Brewers 285
Houston Astros 281
Pittsburgh Pirates 257
Detroit Tigers 252
Cincinnati Reds Continue reading →

Team Stats: Doubles

With 2 months until baseball in Chicago returns, I thought it would be interesting to look at the all time rankings in both offensive and defensive categories for all iterations of the current 30 teams for the 833 games I’ve identified that I have attended. We continue today on the offensive side of the ball with doubles.

Based on the raw numbers, the White Sox and Cubs are far and away the leaders in this category, as they are the teams I’ve seen the most.  When you adjust the numbers per game, the Diamondbacks, Blue Jays, and the Anaheim version of the Angels are the only teams with 2 doubles or more per game.  The Miami iteration of the Marlins are at the bottom, with 1 double every other game, followed by the California incarnation of the Angels, who went double-less.

Doubles
Team Name Doubles
Chicago White Sox 770
Chicago Cubs 671
Kansas City Royals 81
Houston Astros 78
Minnesota Twins 76
Detroit Tigers 75
Cleveland Indians 69
Milwaukee Brewers 67
Pittsburgh Pirates 64
Texas Rangers Continue reading →

Team Stats: Bases On Balls

With 2 months until baseball in Chicago returns, I thought it would be interesting to look at the all time rankings in both offensive and defensive categories for all iterations of the current 30 teams for the 833 games I’ve identified that I have attended. We continue today on the defensive side of the ball with bases on balls surrendered.

Based on the raw numbers, the White Sox and Cubs are far and away the leaders in this category, as they are the teams I’ve seen the most.  When you adjust the numbers per game, 4 teams are averaging 4 or more walks per game, with the California incarnation of the Angels leading the pack with 5.  The Cubs find themselves, unfortunately, in the top 10 at 3.42 walks per game, while the White Sox are in the bottom half (or top half, depending on your point of view) with 3.19 walks per game.  The Anaheim version of the Angels and the Miami version of the Marlins bring up the rear as the only teams with less than 2 walks per game, at 1.5 a piece.

Walks
Team Name Walks
Chicago White Sox 1610
Chicago Cubs 1308
Cleveland Indians 156
Kansas City Royals 151
Cincinnati Reds 133
Pittsburgh Pirates 128
Milwaukee Brewers 125
Seattle Mariners 120
Detroit Tigers 116
Minnesota Twins Continue reading →