Yet Another Mix Tape Monday – Volume 10

33 years ago, during my sophomore year of high school, I put together the first of what would eventually become a nearly 20 volume collection of mix tapes, containing my favorite songs that I had gathered either from the radio, a cassette tape, or (eventually) CD.  Today, we revisit those mix tapes for the fourth time and see how, or if, the soundtrack of my youth still resonates in today’s digital world and how much has changed over the past four years.

It was one of, if not the most ubiquitous song of the summer of 1993.  You heard it blaring out of car windows.  Stacey King and Scott Williams chanted the chorus during the Bulls’ championship rally in Grant Park.  It reached #1 on the Billboard Hot R&B chart and #2 on the Billboard Hot 100.  Whoomp! (There It Is) by Tag Team was everywhere.

While Tag Team never had another hit, this one has been a consistent money maker for the group over the past thirty years.  It has appeared in movies such as Elf, Addams Family Values, and D2: The Mighty Ducks.  It has been a constant at sporting events.  To this day, it plays at Wrigley Field when a Cub hits a home run.  Not that it needed it, but the song got a resurgence in December of 2020 when the members of Tag Team appeared in a Geico add spoofing their song, changing the lyrics to be about ice cream.

I’ve heard the song live twice.  In 2015, Tag Team showed up to 90s Night at the United Center and performed the song at halftime.  They made a similar performance in 2021 before a White Sox game at Guaranteed Rate Field, where they played not just the original, but also the ice cream themed spoof.  Thirty years in, the song shows no signs of slowing down.

Volume 10 covers the spring and summer of 1993, following my freshman year of college, and features the top rap and alternative hits of the summer, along with some pop and the last remnants of hair metal.

Side A

Pearl Jam – Black
iTunes stats: 14 plays, most recently on 11/23/2022

Hitting #3 on Billboard’s Mainstream Rock Tracks chart despite the band’s refusal to release it as an official single, the song was only listened to three times in the past four years.

Def Leppard – Two Steps Behind
iTunes stats: 21 plays, most recently on 7/8/2021

The big hit from Arnold Schwarzenegger’s bomb Last Action Hero, originally recorded from The Blaze during a nightly song battle, garnered just four additional listens over these last four years.

UB40 – Can’t Help Falling In Love
iTunes stats: 27 plays, most recently on 7/30/2022

After going unheard for three years, the track, featured on the Sliver soundtrack, picked up 19 plays since 2015.

Aerosmith – Cryin’
iTunes stats: 21 plays, most recently on 11/1/2022

The first installment of Alicia Silverstone’s video trilogy, which finished as the 60th biggest single of 1993, picked up five new plays over the past four years.

TLC – Get It Up
iTunes stats: 8 plays, most recently on 6/16/2021

This cover of a hit by The Time created for the Poetic Justice soundtrack doubled its listens over the past four years.

4 Non Blondes – What’s Up?
iTunes stats: 27 plays, most recently on 6/1/2022

The 50th biggest single of 1993 picked up eight listens for the ubiquitous debut from 4 Non Blondes.
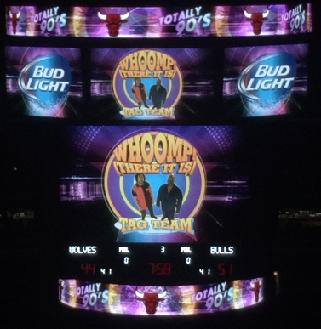
whoompTag Team – Whoomp! (There It Is)
iTunes stats: 62 plays, most recently on 12/8/2022

The unofficial theme to the Bulls third straight NBA championship in 1993, Tag Team, who showed up for 90s night at the UC for a game I attended in February of 2015, added 19 new listens over the past four years, thanks to its use by the Cubs when someone hits a home run.

Side B

Continue reading →

Travelling The 50 States – Texas

Over my 48 years, I’ve done my fair share of travelling across these United States.  I thought it would be an interesting experiment go look back at those trips to each of the 31 states I have visited (62% isn’t bad, is it?) and see if, and when, I may be returning.  Working in alphabetical order, we continue today with the 28th state to be added to the Union: Texas.

State: Texas
Joined the Union: 1845
Visits: 4

After my dad moved there while I was in high school, I’ve made four trips to the Lone Star State, first in 1992 and most recently in 2005.

My first trip to the Dallas metroplex came in the summer of 1992.  My dad had moved there about two years earlier, and this was the first time my sister and I had been invited to visit.  I was there for a week, while my sister stayed for two, since I was getting ready to go away to college for the first time.  The activities I remember from that week include a trip to the rodeo, spending time in the swimming pool, and going to the former book depository to see the exhibit on the assassination of JFK.

I returned solo in 1998.  My only recollection from this trip was making my first visit to The Ballpark In Arlington, seeing the Rangers defeat the Royals in a high scoring affair.

My next visit came three years later, in early May of 2001.  Again, I don’t remember much about the trip, other than two additional visits to the Ballpark, first to see the Rangers lose to the Tigers and then, two nights later, to see them top the White Sox 2-0.

My latest trip to the Metroplex was in 2005.  The things I remember from this trip include trying to scam free WIFI from the house next doon, since my dad did not have a network set up, and a four game series between the Rangers and White Sox at the renamed Ameriquest Field, which the Rangers took three games to two.

Will I return?  Probably, some day.  The Rangers have built a new ballpark and I’ve never been to Houston, so I have to make those trips at some point.  Thanks to Purdue’s epic collapse in the NCAA Tournament on Friday, I don’t have to worry about traveling to Houston in April for the Final Four.

Travelling The 50 States – Ohio

Over my 48 years, I’ve done my fair share of travelling across these United States.  I thought it would be an interesting experiment go look back at those trips to each of the 31 states I have visited (62% isn’t bad, is it?) and see if, and when, I may be returning.  Working in alphabetical order, we continue today with the 17th state to be added to the Union: Ohio.

State: Ohio
Joined the Union: 1803
Visits: 1112 (I think)

Over the years, I’ve made at least eleven trips to the Buckeye State, first in 1996 and most recently in 2019.

My first trip would have been in early May of 1996.  At the end of finals week, a group of us headed out from West Lafayette for a day trip to King’s Island amusement park.  Things I remember from this trip: stopping at or near the campus of Miami of Ohio for food, I’m assuming on the way there and a group of Ferengi characters chasing after the ladies in our group and asking them to stroke their ears.  I don’t remember any particular rides, though I’m sure we partook.

I would return to Ohio on Friday, April 7, 2000 to see the Cubs battle the Reds and their newest acquisition, Ken Griffey Jr.  An eclectic group started the morning way too early with Krispy Kreme donuts at the house before heading towards Cincinnati.  Along the way, there was a brief stop in West Lafayette, because why not, and further along in Indiana for the trifecta of a KFC/Taco Bell/Pizza Hut for lunch.  We arrived in Cincinnati well before the stadium opened, so some time was spent walking around the bustling metropolis that was, and continues to be, Cincinnati.  Our tickets were in the upper deck and, to be honest, I have little to no recollection of the game itself, which the Cubs won 10-6.  My one and only memory of the game is losing my balance and tumbling down 5-10 rows, landing on a group of fans below.  Certainly not my proudest moment.

I returned to Ohio, and the Cincinnati area, in at the end of April in 2003.  My friend Scott had moved to Ohio at some point, and I went for a weekend visit.  Aside from a trip to the local comic shops, the highlight was visiting the brand new Great American Ball Park.  The Padres were in town to battle Reds and we got to check out what the new stadium had to offer.

The next season, the Cubs opened their season in Cincinnati against the Reds, so another trip was in order.  My friend Pete and I headed out early in the morning, meeting up with Scott and walking across the bridge from Kentucky back to Ohio to get to the ballpark.  Vice President Dick Cheney was on hand to throw out the first pitch, and the Cubs pulled out the victory.

I returned to the Cincinnati area in August of 2005, where I attended the Reds game against the Diamondbacks, kicking off a string of three stadiums in three states in nine days.

In 2006, the Cubs once again opened their season on the road against the Reds and again it constituted a road trip down to see, where this time President George W Bush threw out the first pitch.

I made a return trip that summer for interleague play to see the White Sox battle the Reds.

In 2007, when the Cubs were looking to clinch the division, I made the trip down, but missed it by one day.

The next year, I made my final, to date, trip down to Cincinnati and saw the Rockies defeat the Reds. Continue reading →

Yet Another Mix Tape Monday – Volume 5

33 years ago, during my sophomore year of high school, I put together the first of what would eventually become a nearly 20 volume collection of mix tapes, containing my favorite songs that I had gathered either from the radio, a cassette tape, or (eventually) CD. Today, we revisit those mix tapes for the fourth time and see how, or if, the soundtrack of my youth still resonates in today’s digital world and how much has changed over the past four years.

I got my first CD player, and my first CD, for Christmas in 1991.  My sister and I were going to Florida to celebrate Christmas with the grandparents, so we celebrated at home early.  In order to enjoy my new gift while I was gone, I added two songs from that CD, Poison’s Swallow This Live, to this collection.

My CD collection grew slowly, being a poor high school student.  When I left for college that next August, I had added five CDs to the collection: Def Leppard’s Adrenalize, the so-called Black Album from Metallica, Use Your Illusion II by Guns N’ Roses, Boyz II Men’s Motownphilly, and C.M.B. from Color Me Badd.  In college, things started to grow more quickly and, once I got out of college and had some real disposable income, things went a little crazy.  I have CDs where not only is there not a song on there that I like, but there isn’t even a song that I know.

That slowed down a bit as technology advanced, replacing physical media with digital downloads and, eventually, streaming.  I can count on one hand the number of CDs I’ve bought in the last eight years.  The question now is what do I do with 30+ years’ worth of CDs that are never used?  Everything is ripped to my computer and the only CD player I have now is that computer.  Plus, I could use the space that a cabinet full of untouched CDs is taking up in the office.  Something to consider as I remake my workspace now that I am a full-time remote worker.

Volume 5 takes us from the end of my junior year of high school, through the summer, and all the way to spring of my senior year, from mid 1991 through early 1992, and once again features a healthy dose of hair metal and pop.

Side A

Firehouse – Don’t Treat Me Bad
iTunes stats: 21 plays, most recently on 11/12/2021

Peaking at #19 on the Billboard charts, the first hit from Firehouse picked up nine new listens over the past four years.

Color Me Badd – I Wanna Sex You Up
iTunes stats: 19 plays, most recently on 12/12/2021

Featured on the soundtrack for New Jack City, the first single from the R&B boy band, which I had on cassingle, added five new spins since 2019.

Boyz II Men – Motownphilly
iTunes stats: 26 plays, most recently on 8/20/2021

The debut release from the Philadelphia crooners, which hit #3 on the Billboard charts, had a healthy seven play increase since last we checked.

Mötley Crüe – Don’t Go Away Mad (Just Go Away)
iTunes stats: 43 plays, most recently on 9/27/2022

The fourth single off of Dr. Feelgood, originally recorded off 103.5 The Blaze, gets a nice thirteen listen increase thanks to its use at Guaranteed Rate Field after strikeouts from White Sox pitchers.

Slaughter – Fly To The Angels
iTunes stats: 19 plays, most recently on 11/4/2021

Six new plays for the second single from the band’s debut album, which peaked at #19 on the Billboard charts.

Boyz II Men – It’s So Hard To Say Goodbye
iTunes stats: 62 plays, most recently on 12/31/2021

Originally written for the 70s film Cooley High, the cover, originally recorded off the radio from Hot 94.7, saw a fourteen-spin increase over the past four years when you count both the radio and album versions.

Salt-N-Pepa – Let’s Talk About Sex
iTunes stats: 25 plays, most recently on 7/22/2022

The tune, nominated for the 1992 Best Rap Performance by a Duo or Group Grammy, increased its play total by eight since 2019.

Side B

Continue reading →

2023 Tickets – Southside Edition

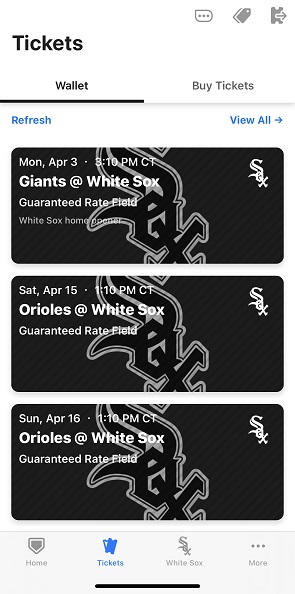
This was a much more exciting day back when the White Sox delivered physical tickets for non-premium season ticket holders, but season tickets have been uploaded to the MLB Ballpark app.  While this does make the actual game day use of the tickets more convenient, I can’t help but miss the old days of paper tickets and getting a big, fancy box filled with tickets in the mail.

Team Stats: Games Per Team

Today, we wrap up our look at the all-time rankings for all iterations of the current 30 teams for the 1040 games I’ve identified that I have attended.  Opening Day is just under two months away and spring training camps are getting ready to roll in just a week or two, so let’s finish things off with the total number of games per team.

With the newly unbalanced schedule starting this year, the Central Division in each league will not score as heavily going forward.  In fact, you have to drop down to seventh place in the current rankings to find a team not in the Central Division and to tenth place to find the first team that was never in the Central.  The addition of expanded interleague play should also shake things up a bit moving forward.

Games Per Team

Team Name Total Games
Chicago White Sox 672
Chicago Cubs 437
Minnesota Twins 68
Kansas City Royals 62
Detroit Tigers 59
Cleveland Indians 58
Houston Astros 49
Pittsburgh Pirates 46
Milwaukee Brewers 41
Seattle Mariners 40
Cincinnati Reds 40
Texas Rangers 39
Baltimore Orioles 36
Los Angeles Angels 35
St. Louis Cardinals Continue reading →

Team Stats: Home Runs

It will be two months until baseball returns to Chicago, so I thought it would be a good time to revisit, for the first time in six years, the all-time rankings in both offensive and defensive categories for all iterations of the current 30 teams for the 1040 games I’ve identified that I have attended.  We continue today on the offensive side of the ball with home runs.

As you might expect by this point, the White Sox and Cubs, based on the raw numbers, are far and away the leaders in this category, as they are, as always, the teams I’ve seen most often.  When you adjust the numbers per game, the California incarnation of the Angels and the Guardians are the only teams at or above two home runs per game.  The Nationals and the Anaheim version of the Angels are the only teams with less than a home run every other game.

Home Runs

TeamName TotalTriples
Chicago White Sox 811
Chicago Cubs 498
Cleveland Indians 72
Kansas City Royals 68
Detroit Tigers 66
Minnesota Twins 65
Seattle Mariners 58
Texas Rangers 49
Boston Red Sox 49
Houston Astros 48
Milwaukee Brewers 45
New York Yankees 44
St. Louis Cardinals 42
Oakland Athletics 42
Baltimore Orioles Continue reading →

Party Of One

The baseball world had turned its attention to snowy hamlet of Cooperstown in upstate New York, where the votes were tallied and the 2023 Hall of Fame class is now complete with one additional member.  Former Phillies and Cardinals third baseman Scott Rolen scored 76.3% of the vote to earn enshrinement in his sixth election.

Four others tallied greater than 50% of the vote, led by Todd Helton, who jumped up to 72.2% and seems like a lock to be elected next year.  Billy Wagner came in with 68.1% and has two more attempts to make it over 75%.  Andruw Jones got a big lift, jumping up to 58.1%.  Finally, Gary Sheffield, with just one election left, rises to 55% and looks unlikely to make that final jump in his last year.

On the local front, Manny Ramirez, who spent a little more than a month with the White Sox, saw a small increase in support, finishing with 33.2% of the vote thanks to his multiple PED suspensions.  The disgraced Omar Vizquel, accused of both sexual abuse of an autistic teen and spousal abuse since being added to the ballot, dropped even more, down to 19.5%.  Jimmy Rollins, who spent the final 41 games of his career on the south side, picked up 12.9% in his second go-around.  Mark Buehrle jumped back up to 10.8% in his third time on the ballot, living to fight another day.  Former Cub pitcher John Lackey nabs a single vote.

Thirteen players will fall off the ballot after failing to score 5% of the vote.

As for the newest Hall of Famer, I’ve seen Rolen play 18 times.  He joins Fred McGriff, who was elected by the veteran’s committees in December, in the class of 2023.  They will both get their day in the sun on Sunday, July 23.

Scott Rolen’s numbers in games I’ve attended were:

Continue reading →

Team Stats: Earned Run Average

With less than three months until baseball returns to Chicago, I thought it would be a good time to revisit, for the first time in six years, the all-time rankings in both offensive and defensive categories for all iterations of the current 30 teams for the 1040 games I’ve identified that I have attended.  We wrap up the defensive side of the ball today with earned run average.

Both the White Sox and Cubs find themselves in the middle of the pack for team ERA, with the Cubs coming in at 14th with 4.00 and the White Sox at 17th with a team ERA of 4.20.  The Anaheim iteration of the Angels lead the way, finishing mere percentage points below 2.60.  The Devil Rays are on the opposite end of the spectrum, clocking in just over 5.95.

Earned Run Average

Team Name ERA
Anaheim Angels 2.59620377314948
Arizona Diamondbacks 2.92054914270955
Washington Nationals 3.16720186512999
Montreal Expos 3.4000755572346
Los Angeles Dodgers 3.41129032258065
Colorado Rockies 3.58507711650256
Los Angeles Angels 3.65023417507605
San Francisco Giants 3.69195184152779
Boston Red Sox 3.70899413615711
Oakland Athletics 3.84286934244236
Tampa Bay Rays 3.87647371109753
Miami Marlins 3.9375
Philadelphia Phillies 3.96004525766009
Chicago Cubs 3.99524314872638
New York Mets Continue reading →

Team Stats: Runs Batted In

It will be less than three months until baseball returns to Chicago, so I thought it would be a good time to revisit, for the first time in six years, the all-time rankings in both offensive and defensive categories for all iterations of the current 30 teams for the 1040 games I’ve identified that I have attended.  We continue today on the offensive side of the ball with runs batted in.

Based on the raw numbers, the White Sox and Cubs are far and away the leaders in this category, as they are the teams I’ve seen most often.  When you adjust the numbers per game, the California iteration of the Angels and the Guardians lead the way as the only teams over seven.  The Nationals and the Miami incarnation of the Marlins are the only teams that failed to average three runs batted in per game.

Runs Batted In

Team Name RBIs
Chicago White Sox 2943
Chicago Cubs 1899
Cleveland Indians 286
Minnesota Twins 261
Kansas City Royals 247
Detroit Tigers 247
Houston Astros 221
Milwaukee Brewers 194
Texas Rangers 182
Boston Red Sox 174
Pittsburgh Pirates 172
Cincinnati Reds 169
Seattle Mariners 161
New York Yankees 160
Baltimore Orioles 148
Los Angeles Angels 137
St. Louis Cardinals 135
Los Angeles Dodgers 126
Oakland Athletics 124
Florida Marlins 120
Toronto Blue Jays 115
Arizona Diamondbacks 101
Tampa Bay Rays 96
Atlanta Braves 85
Philadelphia Phillies 79
San Diego Padres 76
San Francisco Giants 76
New York Mets 71
Colorado Rockies 64
Washington Nationals 40
Tampa Bay Devil Rays 32
Cleveland Guardians 22
Montreal Expos 19
California Angels 15
Anaheim Angels 7
Miami Marlins 4

Runs Batted In per Game

Team Name RBIs per Game
California Angels 7.5
Cleveland Guardians 7.33333333333333
Tampa Bay Devil Rays 6.4
Arizona Diamondbacks 5.94117647058824
Boston Red Sox 5.4375
Florida Marlins 5.21739130434783
New York Yankees 5.16129032258065
Cleveland Indians 4.93103448275862
Milwaukee Brewers 4.73170731707317
Texas Rangers 4.66666666666667
Houston Astros 4.51020408163265
Chicago White Sox 4.37946428571429
Chicago Cubs 4.34553775743707
Los Angeles Dodgers 4.3448275862069
Toronto Blue Jays 4.25925925925926
Cincinnati Reds 4.225
Detroit Tigers 4.1864406779661
New York Mets 4.17647058823529
Tampa Bay Rays 4.17391304347826
Baltimore Orioles Continue reading →